UCSF ChimeraX
UCSF ChimeraX is the next-generation molecular visualization program from the UCSF RBVI. Images in this page are CC0 and can be reused freely, although we encourage citing ChimeraX.
See also: ChimeraX Advantages, Example Images
Feature Highlights

3D Symbol Notation for Glycans
The snfg command shows carbohydrate residues using the 3D Symbol Nomenclature for Glycans, in which shapes indicate different sugar classes and colors indicate their stereochemistry:
Symbol Nomenclature for Graphical Representations of Glycans. Varki et al., Glycobiology. 2015 Dec;25(12):1323-4.
3D implementation of the symbol nomenclature for graphical representation of glycans. Thieker et al., Glycobiology. 2016 Aug;26(8):786-7.
Common carbohydrate residues are identified by their PDB residue names as per the wwPDB Chemical Component Dictionary. The image shows 3D-SNFG representations for BDP (β-D-glucuronic acid), BGC (β-D-glucose), GAL (β-D-galactose), and MAN (α-D-mannose) in PDB entry 1cap. See the command file snfg.cxc for image setup other than orientation (requires ChimeraX 1.12 daily build from Jan 15, 2026 or later).
More features...
Conservation grid labels
Residues can be labeled with color-coded grids showing conservation in an associated Profile Grid multiple sequence alignment. The image shows conservation within a disulfide-bonded loop (chain B residues 80-83) of PDB 2B1L based on a redoxin-superfamily sequence alignment.
Conservation grid labels can be shown using the Profile Grid context menu or the sequence grid label command in ChimeraX v1.12 from May 2026 and newer.
More features...
Matchmaker Superposition
The Matchmaker tool (or matchmaker command) is convenient for superimposing related structures without having to worry about numbering or missing residues. It superimposes proteins or nucleic acids by creating a pairwise sequence alignment, then matching the sequence-aligned residues in 3D. Secondary structure helps guide the sequence alignment for better performance on more distantly related proteins with harder-to-align sequences. By default, the fit is iterated to exclude structurally dissimilar regions and superimpose the most similar parts more closely.
The resulting sequence alignments can be displayed, as in this example of three pectate lyases: PDB 1jta, 1bn8, and 2pec (see the command file peclyases.cxc). In the sequence alignments, residues used in the final fit iteration are enclosed in light orange boxes. RMSD values and other fit statistics are reported in the Log.
More features...Morphing Movie
Morphing between atomic structures can be calculated wih the morph command and played back in an animation. This movie shows morphing between two conformations of the FGFR1 kinase domain:
- inactive structure (PDB 3c4f, chain A)
- activated structure (PDB 3gqi, chain A) with phosphorylated tyrosines and bound ATP analog
Morphing and other setup was done with the command file kmorph-prep.cxc, followed by interactively positioning the structure and saving the view with the command view name p1 (generally a session would also be saved at this point), then running kmorph-play.cxc to add 2D labels and record the movie.
More features...
Worms
Worms are specialized cartoons in which “fatness” reflects the values of an attribute such as bfactor or seq_conservation. In the example image, the average atomic B-factor per amino acid residue is shown with both coloring and worms. The structure is a trimer of E. coli porin (PDB 1pho). For image setup, see the command file worms.cxc.
Worms are available in ChimeraX v1.8 daily builds 3/12/24 and newer. Worms and coloring by attribute can be done with the Render by Attribute tool or commands cartoon byattribute (aka worm) and color byattribute.
More features...
Virtual Reality
ChimeraX virtual reality works with HTC Vive, Oculus Rift, and Samsung Odyssey systems (those supported by SteamVR). Any structures, maps, etc. that can be displayed in ChimeraX can be viewed in the headset and manipulated with the hand controllers. Icon toolbars visible in the headset allow changing the scene display or hand-controller button assignments with a single click. Besides rotation, translation, and zooming, useful functions include labeling, distance measurement, bond rotation, placing markers into a map, and changing map contour levels. Virtual-reality (VR) mode can be turned on and off with the vr command, and the meeting command allows multiple users to share a single session in VR.
More features...
Curved Helix Cylinders
Protein α-helices can be shown as curved-cylinder “tubes“ with the cartoon style command. Helix tube mode is an alternative to the standard spiraling ribbons, and both modes are fully integrated with coil and β-strand cartoons. The structure at left is an AMPA-subtype glutamate receptor bound to the antiepileptic drug perampanel (PDB 5l1f). The receptor is tetrameric, and each chain is rainbow color-coded from blue at the N-terminus to red at the C-terminus. Four molecules of perampanel (pink) are bound near the bottom, between the transmembrane domain and the rest of the receptor. For image setup other than orientation, see the command file ampar.cxc.
See also: Presets menu
More features...
Interactive Chain Network
Chain-chain interfaces can be identified by buried surface areas
and displayed as a network diagram with the
interfaces
command or the
Molecule Display
icon
![]() .
In the diagram, nodes (circles) represent chains,
larger for greater surface areas,
and edges (lines) between nodes represent chain-chain interfaces
(default ≥ 300 Å2 buried area).
Dotted lines represent interfaces smaller than half the size of the
largest in the structure. Diagram context menus enable a variety of actions,
such as “exploding” the structure by moving chains apart,
hiding all but the chains in contact with a given chain,
and showing a more detailed plot of the residues forming a given interface.
.
In the diagram, nodes (circles) represent chains,
larger for greater surface areas,
and edges (lines) between nodes represent chain-chain interfaces
(default ≥ 300 Å2 buried area).
Dotted lines represent interfaces smaller than half the size of the
largest in the structure. Diagram context menus enable a variety of actions,
such as “exploding” the structure by moving chains apart,
hiding all but the chains in contact with a given chain,
and showing a more detailed plot of the residues forming a given interface.
The structure is an HIV envelope glycoprotein trimer bound by three copies of a broadly neutralizing antibody (PDB 5v8m), with chain information shown in the Log. Glycosylations (not displayed) were included in the surface area calculations. For setup, see the command file trimer-network.cxc.
More features...
Assemblies from mmCIF Symmetry Information
Multimeric assemblies defined in a structure's mmCIF file are automatically listed when the file is opened and can be reconstituted with the sym command. The complex of selenocysteine synthase and tRNASec (PDB 3w1k) is shown as molecular surfaces of different colors for different chains. The asymmetric unit is on the left and the assembly specified in the mmCIF file is on the right, with arrow and text annotations from 2dlabels. See the command file sym.cxc.
Alternatively, biological assemblies can be fetched by specifying rcsb_bio or pdbe_bio as the source database.
More features...
Struts for 3D Printing
Structures can be reinforced for 3D printing with pseudobonds. In this DNA-transcription factor complex (PDB 5ego), proteins are shown as ribbons and the DNA as a molecular surface. The pseudobonds in blue were read in from a manually created file, 5ego.pb, and further reinforcements in light gray were added automatically with the struts command. For image setup other than orientation, see the command file struts.cxc.
More features...

|
Adjustable β-Strand Smoothing
Cartoon ribbons are drawn to pass through the exact positions of peptide α-carbons in helix and coil, but by default, strands are smoothed to appear less ripply. This means that α-carbons in strands may not fall on the ribbon. A tether is drawn wherever a sidechain is displayed but would otherwise be detached from the ribbon. (Tether appearance can be adjusted with cartoon tether.)
However, β-strand ribbon smoothing can be tuned continuously between zero (off) and 1.0 (default, fully on), and this can be done for all residues or for specific residues only. The image compares ribbon positions for residues 139 and 164 in the active site of mandelate racemase (PDB 2mnr) with and without smoothing. The unsmoothed position (transparent blue) can be obtained with:
cartoon :139,164 smooth 0
This leaves ribbon smoothing at other residues unchanged. Values between 0 and 1 would give intermediate positions.
More features...

|

|
Rotamers and Swapaa Virtual Mutation
Rotamers is an interface for showing amino acid sidechain rotamers and optionally replacing the original sidechain, also implemented as the swapaa command. The rotamers can be shown all at once, as in the figure, or individually by choosing rows in the dialog.
The figure shows binding-site residues of the thyroid hormone receptor β with hormone bound, PDB 3gws. Rotamers for the hormone-resistance mutations N331H and L346R are shown as partially transparent sticks, with H-bonds (light blue dashed line) and clashes (light purple dashed lines) calculated for the histidine rotamers at position 331. The rotamer-list dialog for this position is also shown. Command script rotamers.cxc contains the initial, noninteractive part of the setup.
These mutations are described in Cardoso et al., Endocrine (2020). Although one histidine rotamer may be able to form the same pocket-stabilizing H-bond as the wild-type asparagine, it also clashes with several atoms (third row in the dialog). H-bonds and clashes are not shown for the arginine rotamers at 346, but they all clash significantly with the hormone and/or other pocket atoms.
More features...
Per-Model Clipping
Front/back (rotatable) clipping can be applied selectively to some models but not others. This is most often used to slice a molecular surface but not the corresponding atomic structure.
For example, the protein in PDB entry
1g74 has an oleic acid residue OLA in an interior pocket.
The script in pmc.cxc
shows the protein surface, activates front clipping for all models,
and then turns it off for just the atomic model, as shown in the figure.
The clipping plane can be translated and rotated interactively
with the mouse
![]()
![]() .
.

|

|
Color Palettes
A “palette” or ordered series of colors is used to color items sequentially (rainbow) or by values such as density. The ten chains in PDB 5o3l (paired tau filament) have been colored with the commands shown as 2D labels in the images. The first two examples at left use predefined palettes (credit to www.ColorBrewer.org, color specifications and designs by Cynthia A. Brewer, Pennsylvania State University), whereas the third shows specifying colors individually.
 More features...
 |
 |
 |
 |
 |
 |
Stylized Nucleotides
Different representations of nucleotides can be shown with the nucleotides command or Toolbar icons. Options include filled rings, slabs for bases (box, muffler, or ellipsoid shape), bumps on slabs to show base orientation, simple tubes instead of ribose atoms, and continuous or broken ladder rungs. Nucleotide representations can be the same color as the ribbon or a different color, and multiple nucleotide styles can be used within a single structure.
See also: Presets menu
More features...
Multichannel Light Microscopy
3D images and time series from multichannel optical microscopy are shown in the Volume Viewer tool, with easy access to hiding/showing individual channels, changing their colors, and adjusting threshold levels with the mouse. The menu of style options includes “volume” (translucent blobs, as in the image), surface, mesh, maximum intensity projection, single plane, and orthoplanes. For convenience, the step size, region bounds, and display style of different channels of the same dataset are coupled, in that changing the setting of one channel automatically changes it for the others.
The image shows human induced pluripotent stem cells, with plasma membrane in violet red, EGFP-tagged fibrillarin (as a marker for nucleolus) in yellow, and DNA (nucleus) in turquoise. The data are publicly available from the Allen Cell Explorer website, dataset: AICS-14_0.
More features...
Multichain Comparative Modeling
Modeller Comparative is an interface to Modeller for comparative (“homology”) modeling of proteins and protein complexes.
The example shows modeling the human (shades of blue) from the mouse (brown and tan) complex of programmed death-1 (PD-1) with its ligand PD-L2, PDB 3bp5.
Comparative modeling requires a template structure and a target-template sequence alignment for each unique chain. The sequences of human PD-1 and PD-L2 targets were fetched from UniProt and associated with the corresponding chains in the template structure, see model-pdl-setup.cxc. (Pairwise or multiple sequence alignments could have been used, but in this case, the template structure was simply associated with the target sequence.) Sequence-structure association shows mismatches in the Sequence Viewer: pink boxes for sequence differences between mouse and human, and gray outlines around the parts missing from the structure.
Three models were made with with default settings (other than the number of models), and the best-scoring model is shown. Two positions where sequence differences change the interfacial H-bonds are displayed.
More features...
View Channels from MOLEonline
The MOLEonline Server calculates channels in protein structures and provides several types of analyses. Results can be downloaded in several different formats, including JSON.
A JSON file downloaded from the MOLEonline Server can be opened in ChimeraX version 1.5 and newer. A sphere model is generated for each channel in the file, and if the file contains more than one channel, a slider interface will appear for flipping through them one by one. Since the channels are individual models in ChimeraX, it is also easy to view more than one at the same time, change their colors, etc. using the Model Panel and/or commands. For image setup, see the command file 2dkh-mole.cxc and data file 2dkh-channels.json. See also the MOLE Channel Coloring by Property tutorial.
More features...
Coloring by Molecular Lipophilicity Potential
Molecular lipophilicity potential (MLP) can be calculated for a protein
and displayed with surface coloring using the command
mlp or the
Molecule Display
icon
![]() .
The image shows the photosynthetic reaction center from a
purple sulfur bacterium, with MLP coloring on the molecular surface
and membrane boundaries from OPM (Orientations of Proteins in Membranes
entry 1eys).
Blue and red balls represent the cytoplasmic and periplasmic sides
of the bacterial inner membrane, respectively.
Parts of the L, M, and H chains span the membrane,
whereas the cytochrome subunit sits on the periplasmic side, at the top.
The surface coloring ranges from dark goldenrod for the most hydrophobic
potentials, through white, to dark cyan for the most hydrophilic.
Ligands including lipid, detergent, heme, and various other cofactors
are shown as purple surfaces.
.
The image shows the photosynthetic reaction center from a
purple sulfur bacterium, with MLP coloring on the molecular surface
and membrane boundaries from OPM (Orientations of Proteins in Membranes
entry 1eys).
Blue and red balls represent the cytoplasmic and periplasmic sides
of the bacterial inner membrane, respectively.
Parts of the L, M, and H chains span the membrane,
whereas the cytochrome subunit sits on the periplasmic side, at the top.
The surface coloring ranges from dark goldenrod for the most hydrophobic
potentials, through white, to dark cyan for the most hydrophilic.
Ligands including lipid, detergent, heme, and various other cofactors
are shown as purple surfaces.
For image setup after the structure from OPM has been opened, see the command file mlp.cxc.
More features...
Find Cavities
Pockets and cavities in protein structures can be identified with the Find Cavities tool or kvfinder command. These run KVFinder, a method based on surface shape developed by the Lopes-de-Oliveira group at the Brazilian Biosciences National Laboratory (details...).
As shown in the figure, the results are listed in an interactive cavity list and can be displayed as dot clouds and/or surfaces.
The latest iteration of this feature is available in ChimeraX 1.10 daily builds 4/17/25 and newer. For image setup other than position and the specific cavity colors (which are assigned randomly after a calculation), see the command file kvfinder.cxc.
More features...
Interactive H-Bond Histogram
Hydrogen bonds (H-bonds) can be identified with the
H-Bonds tool,
hbonds command,
or the
Molecule Display
icon
![]() and plotted as an interactive histogram with the command
crosslinks
histogram.
and plotted as an interactive histogram with the command
crosslinks
histogram.
The ChimeraX graphics window shows the complex between a natural killer cell receptor 2B4 and its ligand CD48 (PDB 2ptt). The receptor protein is blue, the ligand protein pink, and H-bonds between them dashed yellow, with H-bonding residues labeled. Although not done here, the H-bonds could also be labeled by distance.
The histogram of H-bond distances on the top right is interactive: when the cursor is placed over a bar in the histogram, the corresponding H-bonds are temporarily enlarged in the 3D view and the others hidden. For image setup other than orientation, see the command file hb3.cxc.
More features...
Fitting to Density Maps
Atomic structures and/or maps can be fit rigidly into other maps with the
Map
icon
![]() , the
Fit in Map tool,
or the fitmap
command.
A common use is to locally optimize the fit after initial placement by hand.
The command includes options for symmetrical and sequential fitting,
as well as global search
to generate multiple starting points for local optimization.
, the
Fit in Map tool,
or the fitmap
command.
A common use is to locally optimize the fit after initial placement by hand.
The command includes options for symmetrical and sequential fitting,
as well as global search
to generate multiple starting points for local optimization.
Elongator is a highly conserved complex that associates with RNA polymerase II during transcriptional elongation. In the image, one of its six subunits, Elp2 (PDB 5m2n), has been fit into a map of the Elp123 subcomplex (EMDB 4151).
More features...|
|
Embed the 3D Scene in a Web Page
The 3D contents of the ChimeraX graphics window can be embedded in a web page by:
- saving the scene as a GLTF (*.glb) file
- referencing the GLTF file in the HTML source of the web page (details...)

Coulombic Electrostatic Potential
Coulombic electrostatic potential (ESP) can be calculated
and displayed with surface coloring using the command
coulombic
or the
Molecule Display
icon
![]() .
No separate calculation or input ESP file is required.
The image shows the first assembly defined for PDB
3eeb, the protease domain of a toxin from
Vibrio cholerae,
with the default Coulombic coloring: red-white-blue over the value range
–10 to 10. For image setup other than orientation, see the
command file coulombic.cxc.
.
No separate calculation or input ESP file is required.
The image shows the first assembly defined for PDB
3eeb, the protease domain of a toxin from
Vibrio cholerae,
with the default Coulombic coloring: red-white-blue over the value range
–10 to 10. For image setup other than orientation, see the
command file coulombic.cxc.
For how to add a color key and associated label, see the Protein-Ligand Binding Sites tutorial.
More features...
Coloring by Sequence Conservation
Atomic structures, including cartoons and molecular surfaces, can be colored by the conservation in an associated multiple sequence alignment. The figure shows a structure of the β2-adrenergic receptor signaling complex (PDB 3sn6) with receptor cartoon colored blue→white→red from least conserved to most conserved. The β2-adrenergic receptor is a member of the class A G-protein-coupled receptor superfamily. Conservation was calculated from a superfamily alignment from PASS2 using the entropy-based measure from AL2CO (included with ChimeraX courtesy of Pei and Grishin). The sequence alignment and step-by-step instructions for making this image are given in the Coloring by Sequence Conservation tutorial.
More features...Cartoon/Nucleotide Presets
The Presets menu includes a few different combinations of cartoon and nucleotide styles, shown here along with overall settings from the Publication preset plus lighting depthcue false. The style settings of cartoons and nucleotides can be controlled individually (and with many more possibilities than shown here) with cartoon style and nucleotides, respectively. See also: Toolbar nucleotides icons
More features...
ribbons/slabs cylinders/stubs licorice/ovals


Axes, Planes, and Centroids
Axes, planes, and centroids can be defined from sets of atoms using the Axes/Planes/Centroids tool or the command define. The image shows the β2-adrenergic receptor in inactive (gray) and activated (pink) conformations, PDB 2rh1 and 4lde respectively. Hydrophobic membrane boundaries (light tan) are from the Orientations of Proteins in Membranes (OPM) database.
Plane objects were calculated from the membrane-boundary pseudoatoms in 4lde-OPM.pdb. Axes were calculated for the α-helices in both structures and rainbow-color-coded from blue at the N-terminus to red at the C-terminus. Centroids (magenta) were calculated from the two ring systems of the agonist in the activated structure. For image setup other than position, see the command file axes-gpcrs.cxc.
Distances and angles between the defined objects can be measured using the Axes/Planes/Centroids tool or commands, for example, to reveal that the ring systems of the agonist are about 9 Å apart and 3.3 and 8.7 Å from the outer membrane boundary; that upon activation, TM6 (gold axes) tilts by about 15° away from the helix bundle; and that TM4 (green axes, left side of image) makes an angle of about 80-85° with the membrane (see axes-measurements.cxc).
More features...

|
Thermal Ellipsoids
Anisotropic B-factor data can be shown as thermal ellipsoids, axes, or ellipses with the aniso command or the Thermal Ellipsoids tool. The image shows myoglobin structure 1jw8 with thermal ellipsoid representations of the heme residue and protein sidechains that ligate or form H-bonds with the heme. Metal coordination bonds are shown as purple dashed lines and H-bonds as gold dashed lines.
For image setup other than position, see the command file myo-aniso.cxc (requires ChimeraX version 1.10 from February 2025 or newer). More features...
Ambient Occlusion Molecular Surfaces
Several lighting modes are available, including ambient occlusion.
The image shows hemoglobin (PDB
4hhb)
with the four chains shown as surfaces of different colors and
heme residues as spheres. The command
lighting soft
or the Graphics
icon
![]() can be used to turn on ambient shadowing from 64 directions. The command
lighting gentle
gives a similar result, except tuned to emphasize larger indentations.
can be used to turn on ambient shadowing from 64 directions. The command
lighting gentle
gives a similar result, except tuned to emphasize larger indentations.
 |
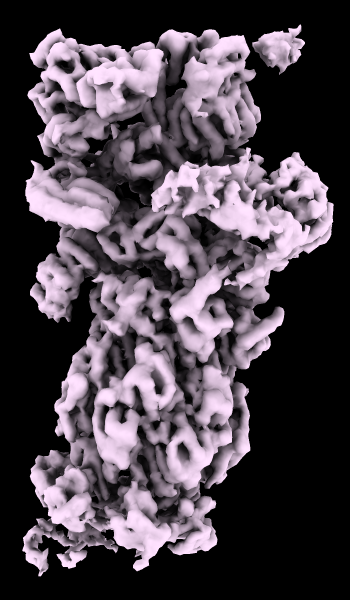 |
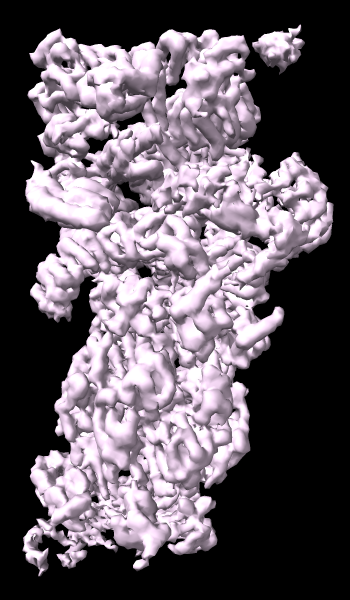
cryoEM Ambient Occlusion
A cryoelectron microscopy map of the 26S proteasome
(EMD-4321) is shown at the author-recommended contour level
in two different lighting modes: “simple” on the left
and “soft” on the right.
Soft lighting includes ambient lighting and shadowing (occlusion)
and can be turned on with the command
lighting soft
or by clicking the
Graphics
icon
![]() .
.
For setup of the righthand image, see the command file ambient.cxc.
More features...
AlphaFold Fetch
AlphaFold is an artificial intelligence method for predicting protein structures. With the AlphaFold tool or command, ChimeraX can search for and load predicted structures from the freely available AlphaFold Database, automatically coloring them by confidence value:
- 100
to 90
– high accuracy - 90
to 70
– backbone accuracy - 70
to 50
– low confidence, caution - 50
to 0
– should not be interpreted, may be disordered
The figure shows the predicted structure of UniProt entry TOM40_HUMAN, a channel protein needed to import other proteins into mitochondria. See the command file tom40.cxc for fetching data and other setup (background color, etc.).
Opening a sequence from UniProt also opens a dialog in which its annotations or “features” can be clicked to highlight those regions in both the sequence and the associated 3D structure. The low-confidence part of this structure (orange and red) maps to compositionally biased and likely disordered regions near the N-terminus of the sequence.
More features...