

 about
projects
people
publications
resources
resources
visit us
visit us
search
search
about
projects
people
publications
resources
resources
visit us
visit us
search
search
Quick Links
Featured Citations
Structure of the ATP-driven methyl-coenzyme M reductase activation complex. Ramírez-Amador F, Paul S et al. Nature. 2025 Jun 19;642(8068):814–821.
Lewy-MSA hybrid fold drives distinct neuronal α-synuclein pathology. Enomoto M, Martinez-Valbuena I et al. Commun Biol. 2025 Jun 16;8(1):929.
Small molecules restore mutant mitochondrial DNA polymerase activity. Valenzuela S, Zhu X et al. Nature. 2025 Jun 12;642(8067):501–507.
PLA2G15 is a BMP hydrolase and its targeting ameliorates lysosomal disease. Nyame K, Xiong J et al. Nature. 2025 Jun 12;642(8067):474–483.
Complex water networks visualized by cryogenic electron microscopy of RNA. Kretsch RC, Li S et al. Nature. 2025 Jun 5;642(8066):250–259.
More citations...News
June 26, 2025
The ChimeraX 1.10 production release is available! See the change log for what's new.
May 7, 2025
The ChimeraX 1.10 release candidate is available – please try it and report any issues. See the change log for what's new.
March 19, 2025

|
Upcoming Events
UCSF ChimeraX (or simply ChimeraX) is the next-generation molecular visualization program from the Resource for Biocomputing, Visualization, and Informatics (RBVI), following UCSF Chimera. ChimeraX can be downloaded free of charge for academic, government, nonprofit, and personal use. Commercial users, please see ChimeraX commercial licensing.
ChimeraX is developed with support from National Institutes of Health R01-GM129325.
Feature Highlight
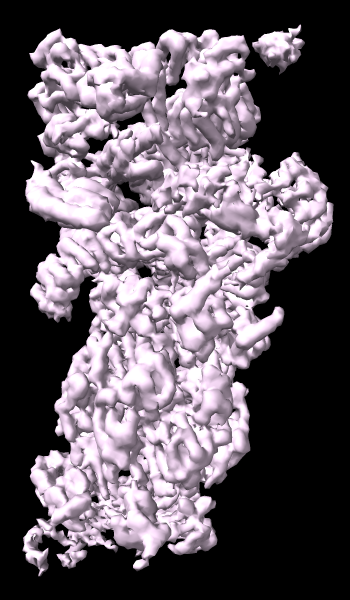
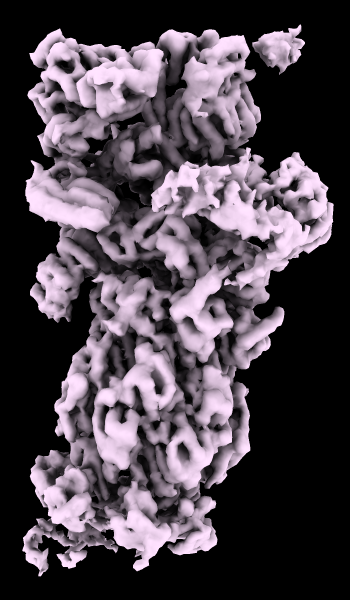
A cryoelectron microscopy map of the 26S proteasome
(EMD-4321) is shown at the author-recommended contour level
in two different lighting modes: “simple” on the left
and “soft” on the right.
Soft lighting includes ambient lighting and shadowing (occlusion)
and can be turned on with the command
lighting soft
or by clicking the
Graphics
icon
For setup of the righthand image,
see the command file ambient.cxc.
Example Image
Atomic B-factor values are read from PDB and mmCIF input files
and assigned as attributes
that can be shown with
coloring
and used in
atom specification.
This example shows B-factor variation within a structure of the
HIV-1 protease bound to an inhibitor
(PDB 4hvp).
For complete image setup, including positioning,
color key, and label,
see the command file bfactor.cxc.
Additional color key examples can be found in tutorials:
Coloring by
Electrostatic Potential,
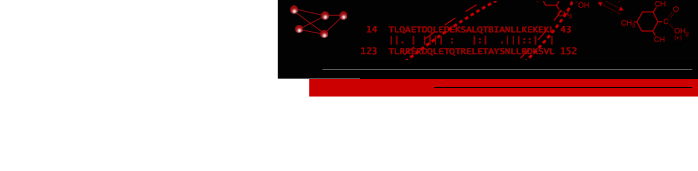
Coloring by Sequence Conservation
cryoEM Ambient Occlusion
![]() .
.

B-factor Coloring
About RBVI | Projects | People | Publications | Resources | Visit Us
Copyright 2018 Regents of the University of California. All rights reserved.