Opened 3 years ago
Last modified 3 years ago
#8646 assigned enhancement
Map-fit scoring
| Reported by: | Tristan Croll | Owned by: | Tom Goddard |
|---|---|---|---|
| Priority: | normal | Milestone: | |
| Component: | Volume Data | Version: | |
| Keywords: | Cc: | gregdp@…, Elaine Meng | |
| Blocked By: | Blocking: | ||
| Notify when closed: | Platform: | all | |
| Project: | ChimeraX |
Description
The following bug report has been submitted:
Platform:        Windows-10-10.0.22621
ChimeraX Version: 1.6.dev202303080949 (2023-03-08 09:49:10 UTC)
Description
I've been working on porting the Q-score algorithm (https://github.com/gregdp/mapq) to ChimeraX (since it's a little embarrassing that despite being a tool for fitting models into maps, ISOLDE doesn't actually have any tool to indicate local map fit). According to some of the recent cryo-EM taskforce outcomes it seems the Q score is still considered one of the better measures. Anyway, I have an implementation that *appears* to be working (i.e. gives sensible-looking results) and I hope runs somewhat faster than the original... but since I'm not actually licensed to use Chimera I can't directly compare the two. Wondering if (a) someone on the team is willing to help run a few tests, and (b) if you'd prefer this to be a more general ChimeraX plugin rather than wrapped into ISOLDE?

If you're interested, the main code is at https://github.com/tristanic/isolde/blob/master/isolde/src/validation/qscore.py. Also uses https://github.com/tristanic/isolde/blob/master/isolde/src/geometry/spherical_k_means.cpp... in the original implementation, for each of 20 radial shells around each atom, it would look for 8 points closer to that atom than any other by first running the chimera equivalent of find_closest_points on an 8-point shell, then 10, then 12... for up to 50 iterations until it found a configuration with enough points. Instead, for radii bigger than about half a bond length I go straight for 128 points, run find_closest_points once to get the set of candidates, and if there are more than 8 use spherical k-means to choose 8 widely-spaced representatives. I think on average that should come out faster...

With the default settings (matching as closely as possible to those in the publication ( i.e. a maximum shell radius of 2 A and a step size of 0.1 A) it takes about 15 seconds to run on 6out (11505 heavy atoms/1720 residues). Not exactly snappy, but it's hard to see how to make it dramatically faster without some serious re-thinking - it's a costly algorithm no matter which way you slice it.

OpenGL version: 3.3.0 NVIDIA 528.24
OpenGL renderer: NVIDIA GeForce RTX 3070 Laptop GPU/PCIe/SSE2
OpenGL vendor: NVIDIA Corporation

Python: 3.9.11
Locale: en_GB.cp1252
Qt version: PyQt6 6.4.2, Qt 6.4.2
Qt runtime version: 6.4.2
Qt platform: windows

Manufacturer: HP
Model: HP ZBook Studio 15.6 inch G8 Mobile Workstation PC
OS: Microsoft Windows 11 Pro (Build 22621)
Memory: 34,007,068,672
MaxProcessMemory: 137,438,953,344
CPU: 16 11th Gen Intel(R) Core(TM) i7-11800H @ 2.30GHz
OSLanguage: en-GB

Installed Packages:
    -himerax-isolde: 1.6.dev0
    alabaster: 0.7.13
    appdirs: 1.4.4
    asttokens: 2.2.1
    Babel: 2.12.1
    backcall: 0.2.0
    beautifulsoup4: 4.11.2
    blockdiag: 3.0.0
    build: 0.10.0
    certifi: 2022.12.7
    cftime: 1.6.2
    charset-normalizer: 3.1.0
    ChimeraX-AddCharge: 1.5.9
    ChimeraX-AddH: 2.2.3
    ChimeraX-AlignmentAlgorithms: 2.0.1
    ChimeraX-AlignmentHdrs: 3.3.1
    ChimeraX-AlignmentMatrices: 2.1
    ChimeraX-Alignments: 2.9.3
    ChimeraX-AlphaFold: 1.0
    ChimeraX-AltlocExplorer: 1.0.3
    ChimeraX-AmberInfo: 1.0
    ChimeraX-Arrays: 1.1
    ChimeraX-Atomic: 1.43.9
    ChimeraX-AtomicLibrary: 10.0.5
    ChimeraX-AtomSearch: 2.0.1
    ChimeraX-AxesPlanes: 2.3.2
    ChimeraX-BasicActions: 1.1.2
    ChimeraX-BILD: 1.0
    ChimeraX-BlastProtein: 2.1.2
    ChimeraX-BondRot: 2.0.1
    ChimeraX-BugReporter: 1.0.1
    ChimeraX-BuildStructure: 2.8
    ChimeraX-Bumps: 1.0
    ChimeraX-BundleBuilder: 1.2.2
    ChimeraX-ButtonPanel: 1.0.1
    ChimeraX-CageBuilder: 1.0.1
    ChimeraX-CellPack: 1.0
    ChimeraX-Centroids: 1.3.2
    ChimeraX-ChangeChains: 1.0.2
    ChimeraX-CheckWaters: 1.3.1
    ChimeraX-ChemGroup: 2.0.1
    ChimeraX-Clashes: 2.2.4
    ChimeraX-Clipper: 0.20.0
    ChimeraX-ColorActions: 1.0.3
    ChimeraX-ColorGlobe: 1.0
    ChimeraX-ColorKey: 1.5.3
    ChimeraX-CommandLine: 1.2.5
    ChimeraX-ConnectStructure: 2.0.1
    ChimeraX-Contacts: 1.0.1
    ChimeraX-Core: 1.6.dev202303080949
    ChimeraX-CoreFormats: 1.1
    ChimeraX-coulombic: 1.4.2
    ChimeraX-Crosslinks: 1.0
    ChimeraX-Crystal: 1.0
    ChimeraX-CrystalContacts: 1.0.1
    ChimeraX-DataFormats: 1.2.3
    ChimeraX-Dicom: 1.2
    ChimeraX-DistMonitor: 1.3.3
    ChimeraX-DockPrep: 1.1.1
    ChimeraX-Dssp: 2.0
    ChimeraX-EMDB-SFF: 1.0
    ChimeraX-ESMFold: 1.0
    ChimeraX-ExperimentalCommands: 1.0
    ChimeraX-FileHistory: 1.0.1
    ChimeraX-FunctionKey: 1.0.1
    ChimeraX-Geometry: 1.3
    ChimeraX-gltf: 1.0
    ChimeraX-Graphics: 1.1.1
    ChimeraX-Hbonds: 2.4
    ChimeraX-Help: 1.2.1
    ChimeraX-HKCage: 1.3
    ChimeraX-IHM: 1.1
    ChimeraX-ImageFormats: 1.2
    ChimeraX-IMOD: 1.0
    ChimeraX-IO: 1.0.1
    ChimeraX-ISOLDE: 1.6.dev0
    ChimeraX-ItemsInspection: 1.0.1
    ChimeraX-Label: 1.1.7
    ChimeraX-ListInfo: 1.1.1
    ChimeraX-Log: 1.1.5
    ChimeraX-LookingGlass: 1.1
    ChimeraX-Maestro: 1.8.2
    ChimeraX-Map: 1.1.4
    ChimeraX-MapData: 2.0
    ChimeraX-MapEraser: 1.0.1
    ChimeraX-MapFilter: 2.0.1
    ChimeraX-MapFit: 2.0
    ChimeraX-MapSeries: 2.1.1
    ChimeraX-Markers: 1.0.1
    ChimeraX-Mask: 1.0.2
    ChimeraX-MatchMaker: 2.0.11
    ChimeraX-MDcrds: 2.6
    ChimeraX-MedicalToolbar: 1.0.2
    ChimeraX-Meeting: 1.0.1
    ChimeraX-MLP: 1.1.1
    ChimeraX-mmCIF: 2.12
    ChimeraX-MMTF: 2.2
    ChimeraX-Modeller: 1.5.8
    ChimeraX-ModelPanel: 1.3.6
    ChimeraX-ModelSeries: 1.0.1
    ChimeraX-Mol2: 2.0
    ChimeraX-Mole: 1.0
    ChimeraX-Morph: 1.0.2
    ChimeraX-MouseModes: 1.2
    ChimeraX-Movie: 1.0
    ChimeraX-Neuron: 1.0
    ChimeraX-Nifti: 1.0
    ChimeraX-NRRD: 1.0
    ChimeraX-Nucleotides: 2.0.3
    ChimeraX-OpenCommand: 1.10.1
    ChimeraX-PDB: 2.7
    ChimeraX-PDBBio: 1.0
    ChimeraX-PDBLibrary: 1.0.2
    ChimeraX-PDBMatrices: 1.0
    ChimeraX-PickBlobs: 1.0.1
    ChimeraX-Positions: 1.0
    ChimeraX-PresetMgr: 1.1
    ChimeraX-PubChem: 2.1
    ChimeraX-ReadPbonds: 1.0.1
    ChimeraX-Registration: 1.1.1
    ChimeraX-RemoteControl: 1.0
    ChimeraX-RenderByAttr: 1.1
    ChimeraX-RenumberResidues: 1.1
    ChimeraX-ResidueFit: 1.0.1
    ChimeraX-RestServer: 1.1
    ChimeraX-RNALayout: 1.0
    ChimeraX-RotamerLibMgr: 3.0
    ChimeraX-RotamerLibsDunbrack: 2.0
    ChimeraX-RotamerLibsDynameomics: 2.0
    ChimeraX-RotamerLibsRichardson: 2.0
    ChimeraX-SaveCommand: 1.5.1
    ChimeraX-SchemeMgr: 1.0
    ChimeraX-SDF: 2.0.1
    ChimeraX-Segger: 1.0
    ChimeraX-Segment: 1.0.1
    ChimeraX-SelInspector: 1.0
    ChimeraX-SeqView: 2.8.3
    ChimeraX-Shape: 1.0.1
    ChimeraX-Shell: 1.0.1
    ChimeraX-Shortcuts: 1.1.1
    ChimeraX-ShowSequences: 1.0.1
    ChimeraX-SideView: 1.0.1
    ChimeraX-Smiles: 2.1
    ChimeraX-SmoothLines: 1.0
    ChimeraX-SpaceNavigator: 1.0
    ChimeraX-StdCommands: 1.10.1
    ChimeraX-STL: 1.0.1
    ChimeraX-Storm: 1.0
    ChimeraX-StructMeasure: 1.1.1
    ChimeraX-Struts: 1.0.1
    ChimeraX-Surface: 1.0.1
    ChimeraX-SwapAA: 2.0.1
    ChimeraX-SwapRes: 2.2.1
    ChimeraX-TapeMeasure: 1.0
    ChimeraX-Test: 1.0
    ChimeraX-Toolbar: 1.1.2
    ChimeraX-ToolshedUtils: 1.2.1
    ChimeraX-Topography: 1.0
    ChimeraX-Tug: 1.0.1
    ChimeraX-UI: 1.28.2
    ChimeraX-uniprot: 2.2.2
    ChimeraX-UnitCell: 1.0.1
    ChimeraX-ViewDockX: 1.2
    ChimeraX-VIPERdb: 1.0
    ChimeraX-Vive: 1.1
    ChimeraX-VolumeMenu: 1.0.1
    ChimeraX-VTK: 1.0
    ChimeraX-WavefrontOBJ: 1.0
    ChimeraX-WebCam: 1.0.2
    ChimeraX-WebServices: 1.1.1
    ChimeraX-Zone: 1.0.1
    colorama: 0.4.6
    comm: 0.1.2
    comtypes: 1.1.14
    contourpy: 1.0.7
    cxservices: 1.2.2
    cycler: 0.11.0
    Cython: 0.29.33
    debugpy: 1.6.6
    decorator: 5.1.1
    docutils: 0.19
    executing: 1.2.0
    filelock: 3.9.0
    fonttools: 4.39.0
    funcparserlib: 1.0.1
    grako: 3.16.5
    h5py: 3.8.0
    html2text: 2020.1.16
    idna: 3.4
    ihm: 0.35
    imagecodecs: 2022.9.26
    imagesize: 1.4.1
    importlib-metadata: 6.0.0
    ipykernel: 6.21.1
    ipython: 8.10.0
    ipython-genutils: 0.2.0
    ipywidgets: 8.0.4
    jedi: 0.18.2
    Jinja2: 3.1.2
    jupyter-client: 8.0.2
    jupyter-core: 5.2.0
    jupyterlab-widgets: 3.0.5
    kiwisolver: 1.4.4
    line-profiler: 4.0.2
    lxml: 4.9.2
    lz4: 4.3.2
    MarkupSafe: 2.1.2
    matplotlib: 3.6.3
    matplotlib-inline: 0.1.6
    msgpack: 1.0.4
    nest-asyncio: 1.5.6
    netCDF4: 1.6.2
    networkx: 2.8.8
    nibabel: 5.0.1
    nptyping: 2.5.0
    numexpr: 2.8.4
    numpy: 1.23.5
    openvr: 1.23.701
    packaging: 23.0
    pandas: 1.5.3
    ParmEd: 3.4.3
    parso: 0.8.3
    pep517: 0.13.0
    pickleshare: 0.7.5
    Pillow: 9.3.0
    pip: 23.0
    pkginfo: 1.9.6
    platformdirs: 3.1.0
    prompt-toolkit: 3.0.38
    psutil: 5.9.4
    pure-eval: 0.2.2
    pycollada: 0.7.2
    pydicom: 2.3.0
    Pygments: 2.14.0
    pynrrd: 1.0.0
    PyOpenGL: 3.1.5
    PyOpenGL-accelerate: 3.1.5
    pyparsing: 3.0.9
    pyproject-hooks: 1.0.0
    PyQt6-commercial: 6.4.2
    PyQt6-Qt6: 6.4.2
    PyQt6-sip: 13.4.1
    PyQt6-WebEngine-commercial: 6.4.0
    PyQt6-WebEngine-Qt6: 6.4.2
    python-dateutil: 2.8.2
    pytz: 2022.7.1
    pywin32: 305
    pyzmq: 25.0.0
    qtconsole: 5.4.0
    QtPy: 2.3.0
    RandomWords: 0.4.0
    requests: 2.28.2
    scipy: 1.9.3
    setuptools: 67.4.0
    sfftk-rw: 0.7.3
    six: 1.16.0
    snowballstemmer: 2.2.0
    sortedcontainers: 2.4.0
    soupsieve: 2.4
    sphinx: 6.1.3
    sphinx-autodoc-typehints: 1.22
    sphinxcontrib-applehelp: 1.0.4
    sphinxcontrib-blockdiag: 3.0.0
    sphinxcontrib-devhelp: 1.0.2
    sphinxcontrib-htmlhelp: 2.0.1
    sphinxcontrib-jsmath: 1.0.1
    sphinxcontrib-qthelp: 1.0.3
    sphinxcontrib-serializinghtml: 1.1.5
    stack-data: 0.6.2
    tables: 3.7.0
    tcia-utils: 1.0.2
    tifffile: 2022.10.10
    tinyarray: 1.2.4
    tomli: 2.0.1
    tornado: 6.2
    traitlets: 5.9.0
    typing-extensions: 4.5.0
    urllib3: 1.26.14
    wcwidth: 0.2.6
    webcolors: 1.12
    wheel: 0.38.4
    wheel-filename: 1.4.1
    widgetsnbextension: 4.0.5
    WMI: 1.5.1
    zipp: 3.15.0
Attachments (12)
Change History (82)
comment:1 by , 3 years ago
| Component: | Unassigned → Volume Data |
|---|---|
| Owner: | set to |
| Platform: | → all |
| Project: | → ChimeraX |
| Status: | new → assigned |
| Summary: | ChimeraX bug report submission → Map-fit scoring |
| Type: | defect → enhancement |
comment:2 by , 3 years ago
| Cc: | added |
|---|
follow-up: 3 comment:3 by , 3 years ago
Ok, thanks. I’d be perfectly happy to contribute this code (once tested, of
course) if you want to roll it in to the Segger plugin to match Chimera.

On Tue, 14 Mar 2023 at 18:36, ChimeraX <ChimeraX-bugs-admin@cgl.ucsf.edu>
wrote:
follow-up: 4 comment:4 by , 3 years ago
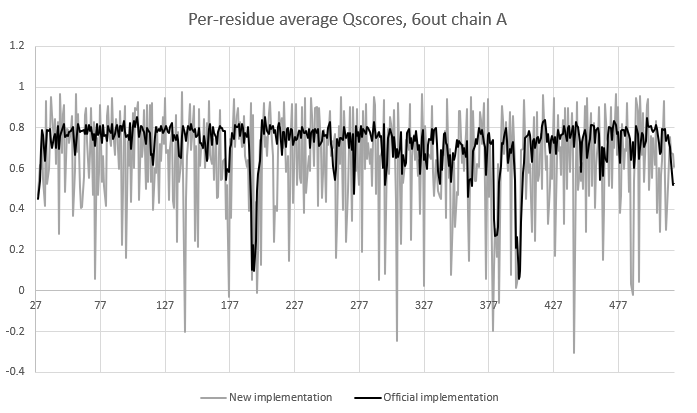
So the good news is that this implementation is about 60 times faster (~15
seconds vs. about 15 minutes for the same map/model combo). The bad news is
that it's getting the wrong answers. :)

Seems to be in the right ballpark (see attached plot of residue number vs
Qscore), but per-residue average scores are much noisier, and occasionally
dip to very low values for residues which appear fine in the map. Greg:
since this is your algorithm you of course know it best - would you be
interested in working together to fix this up and flesh it out?

[image: image.png]

On Tue, Mar 14, 2023 at 6:50 PM ChimeraX <ChimeraX-bugs-admin@cgl.ucsf.edu>
wrote:

comment:5 by , 3 years ago
Hi Tom, Tristan,

May not be wrong, just a different score :) there are some subtleties to the Q-score which make it rather slow, but on the other hand it better represents each atom - overkill for lower res. but seemed necessary at higher ones.

It could be for local fitting, a faster/simpler CC-score would still be ok, if it turns out Q-score could not be optimized more. The slow part is basically looking for all atoms near each atom, and distributing points around it so that they are not closer to other atoms. It was done initially with the chimera CGLutil.AdaptiveTree class before, but then I made a faster grid-based object which sped it up a bit. This is really only interesting though if you want a score for each atom, and again it is prob. meaningful only for higher res, like say ~2Å. At ~3-5Å, the only reason to do it that way is really for consistency, but a per-residue CC would be faster and probably more than adequate.

Anyway I would be happy to help and discuss more. Might be easiest if we have a zoom call sometime? We can go through the chimera python implementation to point out some of those subtleties and see if they could be done faster. I really need to move to chimerax, maybe this will hook me in finally...

Greg
follow-up: 5 comment:6 by , 3 years ago
Hi Greg,
The slow part is basically looking for all atoms near each atom, and distributing points around it so that they are not closer to other atoms.
This version is supposed to be doing the same thing, just trying to use a more efficient approach (helped along enormously by Tom's super-optimised find_close_points and find_closest_points routines). In essence, here's what it does for each atom:
- finds all other atoms within (2 *
max_shell_radius+ 1) angstroms - for each
shell_radiusin steps ofstep(default 0.1) up to `max_shell_radius) (default 2.0), tries to find 8 points closer to the focus atom than the others.
So far that should be identical to your implementation, but *how* it does it is a little different. For radii less than about half a C-C bond length it first tries with 8 evenly-distributed test points. For larger radii (or if it doesn't find 8 in that test) it jumps straight to using a 128-point shell rather than looping through testing 10, 12, ... 106-point shells, and then (if the number of found points is greater than 8) tries to find widely-separated representative points by doing a few rounds of k-means clustering (with k=8) in polar coordinates and choosing the point closest to each of the resulting centroids. Conceptually it seems to me that should give a very similar result to your approach, which makes me suspect I'm doing something wrong elsewhere.
Would be happy to chat on Zoom. Evenings this week are all full since we have visitors in from the US... Monday or Wednesday next week would work for me.
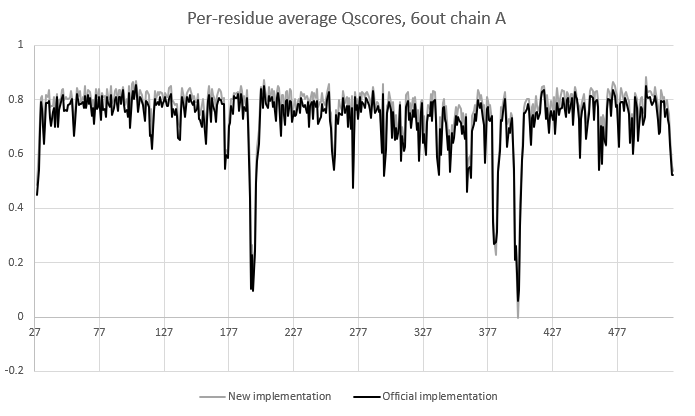
comment:7 by , 3 years ago
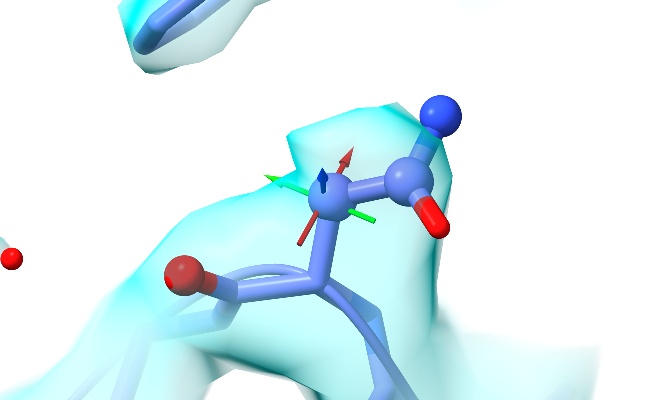
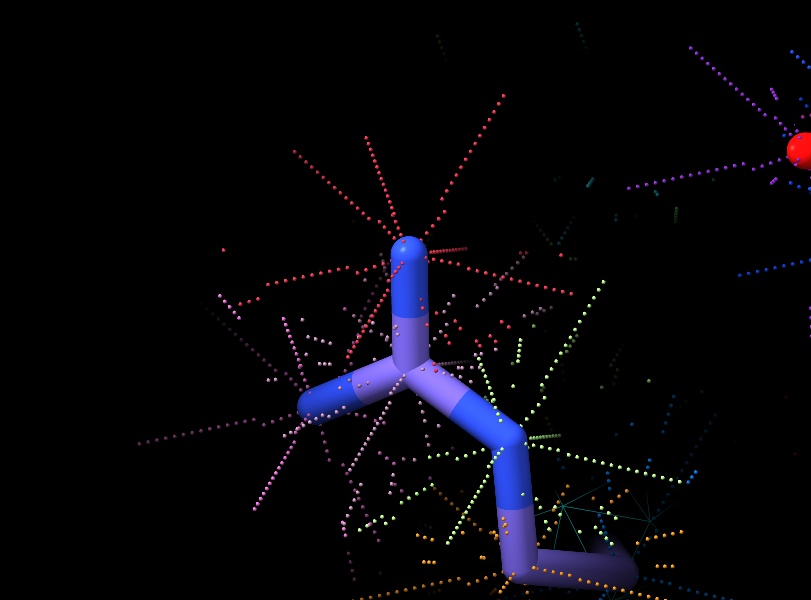
Ah! I think I see the problem. If I understand correctly, in your code the
Q score for a given residue (or other group of atoms) is calculated by
accumulating all the map values and corresponding reference values for all
shell points around all those atoms, then doing the cross-correlation
calculation for all those points at once. Mine is currently calculating
per-atom scores, and then averaging those to get the residue score. So in
the pictured residue, for example, the four atoms shown as spheres each get
strongly negative Q-scores (between -0.3 and -0.9), so in my version the
overall residue score comes out at 0.08 where your approach gives 0.7. So
as you said: not exactly "wrong", just different. :)


[image: low_qscore_residue.jpg]

On Wed, Mar 15, 2023 at 2:22 PM ChimeraX <ChimeraX-bugs-admin@cgl.ucsf.edu>
wrote:

follow-up: 7 comment:8 by , 3 years ago
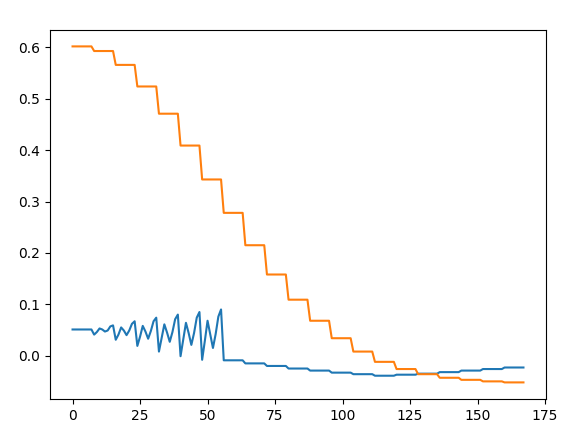
There are still things in here I don't understand, though... residue 196
(which is floating in space in really weak, rubbish density) gets a really
high Q score (0.86) by my approach, and a low one by yours (0.22). If I
actually plot the measured map values and reference gaussian around one of
the atoms, it looks exactly as I'd expect from looking at the atom and map
- i.e. very weak/negative density mostly indistinguishable from noise (blue
= density values around the atom, orange = reference, x axis is simply
point number (8 points per radial shell). As per your code, the Q score is
defined as the corM (third returned value) from
fitmap.overlap_and_correlation - which for this atom is 0.91. What am I
missing here?

[image: image.png]

On Wed, Mar 15, 2023 at 4:39 PM ChimeraX <ChimeraX-bugs-admin@cgl.ucsf.edu>
wrote:

comment:9 by , 3 years ago
To break downs the steps a bit more:

For each atom A
Initialize points list with N points at the same location as atom A
For radius R in range d..2Å at steps of d
- [*] put N points on a sphere at radius R
- make a new temporary points list
- for each point P on the sphere
-- is there atom with distance to P closer than R*0.9 ? yes: discard point or no:add point to temp points list
- repeat from [*] until we keep at least N points; add these points to the point list
- get density values at points in points list, Q-score = CC(about mean) between them and values from reference gaussian (centered at atom position with stdev of S

Parameters:
d: 0.1
S: i initially used 0.6Å, but then Q-scores started to dip for the highest res cryoEM map of 1.15; for higher than 1.5Å, we started to use 0.4Å
R*0.9: this is a bit of a hack so that the atom being considered does not make the condition yes; also does not consider an atom in roughly the same position say for an alternate conformation
N: 8 as you noticed; this is what makes the Q-score different than a normal real-space CC calculation. In the latter, there are more points farther away from the atom; Q-score weights the centre point as much as points 2Å away

I debugged for some time using large N, in steps of d:0.5; start with 50 at d=0.5, increasing as R*R/(d*d) to keep the same density of points; add the ‘kept’ points to a pseudo model and check visually the point detection is working as expected… you should see partial shells around each atom… the close point detection from AdaptiveTree tricked me at first because it was approximate and could return points farther away than the parameter given
follow-up: 8 comment:10 by , 3 years ago
Actually, it could do this, but it does just go atom by atom, then averages Q-score at each atom for the entire residue, side chain atoms, or backbone atoms
comment:11 by , 3 years ago
- for each point P on the sphere -- is there atom with distance to P closer than R*0.9 ? yes: discard point or no:add point to temp points list
This seems effectively equivalent to what I'm doing (for each point P, is the atom of interest closer than all other atoms?).
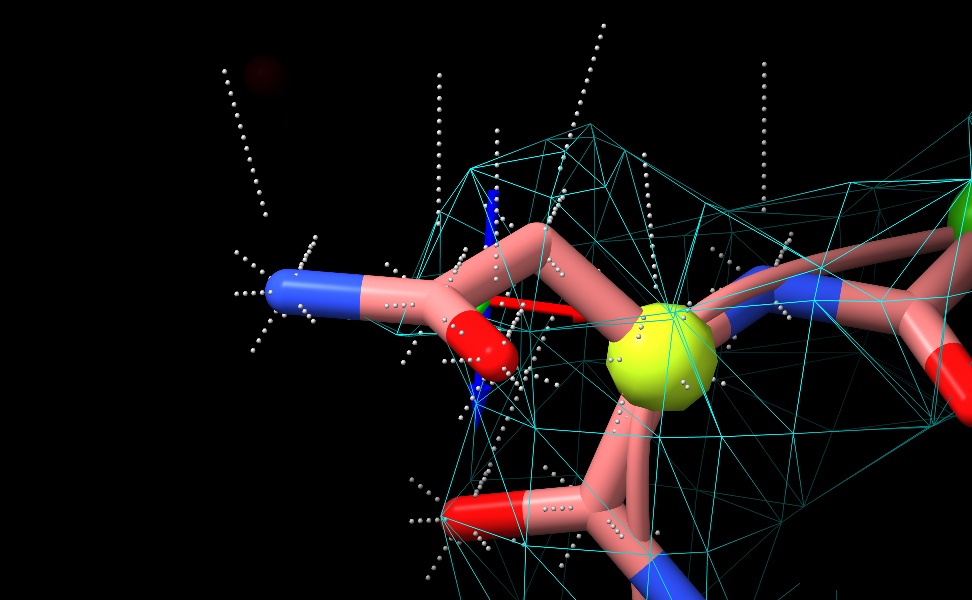
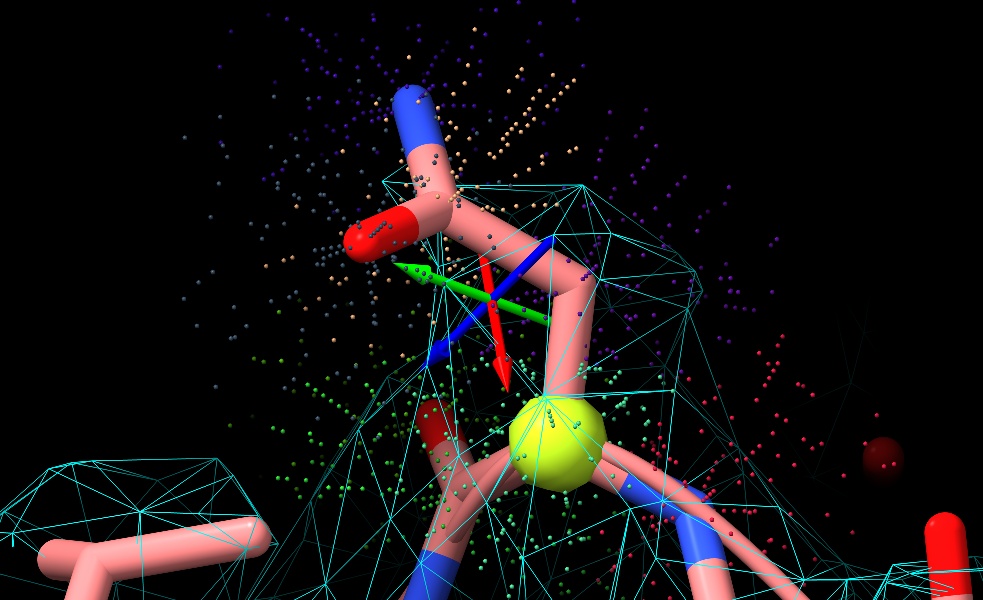
... but drawing all the shell points for one residue makes it clear there's a bug in my clustering code - looks like it's returning the same point 8 times, rather than 8 distributed points. Will track down...
by , 3 years ago
| Attachment: | shell_points_bug.jpg added |
|---|
Once the radius goes beyond the half-bond-length transition, all shell points for a given atom appear to be on the same ray.
follow-up: 9 comment:12 by , 3 years ago
OK - turns out there were a few different (mostly simple, bone-headed)
issues in there, but it's now **really** close to the same result.

[image: image.png]

On Wed, Mar 15, 2023 at 6:42 PM ChimeraX <ChimeraX-bugs-admin@cgl.ucsf.edu>
wrote:

comment:14 by , 3 years ago
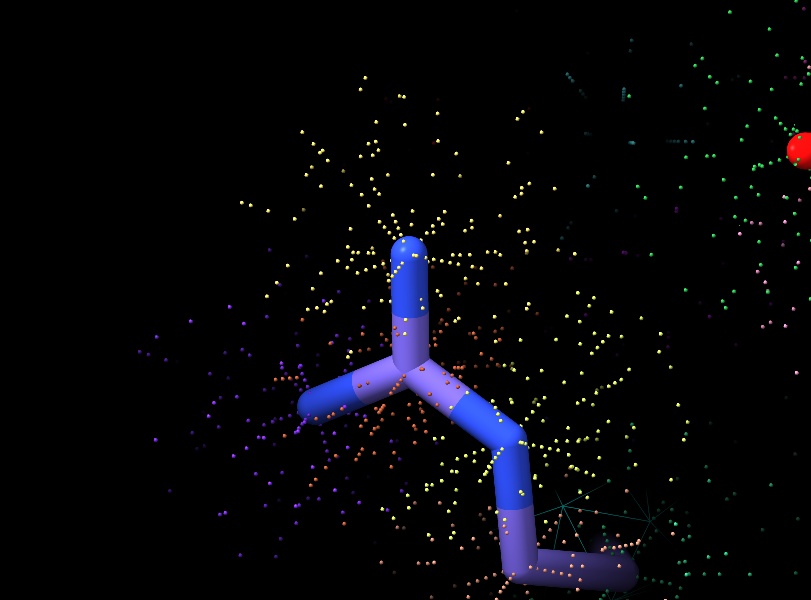
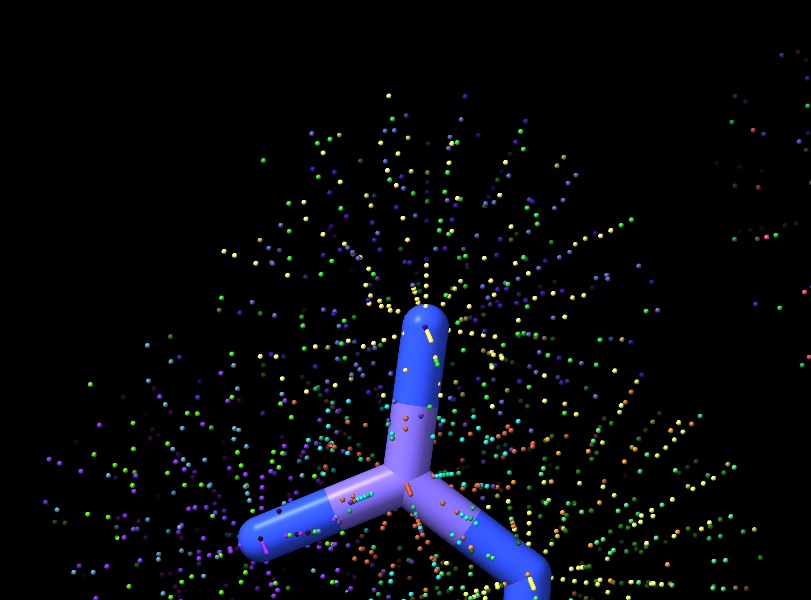
Out of steam for tonight, but will try to do some tidying up of all the
debugging cruft tomorrow and push the updated code. Last check I ran:
distribution of test points now looks nice (different random colour
assigned to each atom).
[image: corrected_test_points.jpg]

On Wed, Mar 15, 2023 at 7:50 PM ChimeraX <ChimeraX-bugs-admin@cgl.ucsf.edu>
wrote:

comment:15 by , 3 years ago
OK, I've cleaned up the code a bit and pushed it to https://github.com/tristanic/isolde/blob/master/isolde/src/validation/qscore.py and https://github.com/tristanic/isolde/blob/master/isolde/src/geometry/spherical_k_means.cpp (the latter uses a few convenience functions from https://github.com/tristanic/isolde/blob/master/isolde/src/geometry/geometry.h, but they could be inlined quite trivially). There is currently a small amount of non-determinism to the results, because the initial centroids for the k-means clustering are chosen randomly from the input points... for two duplicate runs with the same settings, the RMS difference in individual atom scores was 0.03, and the maximum absolute difference for a single atom was 0.24. If needed it could be made fully deterministic by explicitly seeding the centroids with predefined points.
Anyway, before going further I suppose it would be best to decide where this will live. Should we move it to a new repo for a standalone bundle, or roll it into the Segger bundle for consistency with Chimera?
follow-up: 12 comment:16 by , 3 years ago
Some quick profiling output below. There's possibly a little room for optimisation in the k-means code, but I think it's at the point of rapidly diminishing returns. Cutting the number of test points per shell from 128 to 64 shaves off about 2 seconds with fairly minimal effect; increasing the step size to 0.2 A reduces the run time to 8.3 seconds with a slightly higher but probably still quite tolerable effect on the scores. Would be interesting to explore balancing these off as a function of resolution - as Greg says, the standard settings are probably overkill for lower-resolution maps!
%prun -s cumulative q_scores(model.residues, volume)

         3273846 function calls (3258899 primitive calls) in 14.978 seconds

   Ordered by: cumulative time

   ncalls  tottime  percall  cumtime  percall filename:lineno(function)
        1    0.000    0.000   14.978   14.978 {built-in method builtins.exec}
        1    0.000    0.000   14.978   14.978 <string>:1(<module>)
        1    2.947    2.947   14.978   14.978 qscore.py:20(q_score)
   158905    5.267    0.000    5.267    0.000 {built-in method chimerax.isolde._kmeans.spherical_k_means}
   230100    3.272    0.000    3.272    0.000 {built-in method chimerax.geometry._geometry.find_closest_points}
   230098    0.330    0.000    1.586    0.000 arrays.py:17(interpolate_volume_data)
   230098    1.077    0.000    1.077    0.000 {built-in method map_cpp.interpolate_volume_data}
    11505    0.568    0.000    0.568    0.000 {built-in method chimerax.geometry._geometry.find_close_points}
    11505    0.101    0.000    0.437    0.000 fitmap.py:624(overlap_and_correlation)
    46043    0.264    0.000    0.391    0.000 {built-in method numpy.core._multiarray_umath.implement_array_function}
    23010    0.016    0.000    0.270    0.000 <__array_function__ internals>:177(concatenate)
comment:17 by , 3 years ago
Amazing, you may be the first to get a close (and faster) implementation. Interesting idea to go with the k-means approach; more efficient than iterating as I was describing.

I would suggest to keep it in the Isolde repo, for simplicity, and since it doesn’t really have much to do with segmentation, so probably not ideal to have it in Segger. Trying to check it out and compile it, will let you know how it goes.

Greg
follow-up: 13 comment:18 by , 3 years ago
I'm very glad you're happy!

Regarding where it's housed: as Tom suggested it would be nice for people
to have access to this without having ISOLDE installed, which means it
would need to live in a separate bundle (aka plugin). To make life easier
my current model is "one bundle, one repo"... so I think the choice is
between turning it into a new repo on my GitHub, or donating it to the
ChimeraX codebase. Tom, which would you prefer?

What operating system are you using? I could easily provide you with a
build to try out (tomorrow - have a dinner to go to in half an hour).

Best,
Tristan

On Thu, Mar 16, 2023 at 4:24 PM ChimeraX <ChimeraX-bugs-admin@cgl.ucsf.edu>
wrote:
follow-up: 14 comment:19 by , 3 years ago
Ugh… realised one more bone-headed mistake on my part (not shifting the
sphere back to the origin before normalising for the k-means clustering).
Will fix in the morning.

On Thu, 16 Mar 2023 at 17:04, ChimeraX <ChimeraX-bugs-admin@cgl.ucsf.edu>
wrote:
comment:20 by , 3 years ago
OK, fixed now. Also managed to squeeze another ~2 seconds out of my test case - I was doing the clustering by minimising distance between vectors (acos(v1.v2)), but realised the acos is unnecessary and just maximising v1.v2 works just as well. Considering the number of times that calculation is used it really makes a substantial difference.
I looked a bit more at the run-to-run variation, comparing ten runs on the same model/map with identical settings. For protein residues the residue-average Qscore varies roughly +/- 0.02 from the 10-run mean. Most individual atoms vary about +/- 0.04, with a few edge cases spiking to +/- 0.15-0.2. I'm not sure if this is such a bad thing, on the whole.
comment:21 by , 3 years ago
I've just put new dev builds up on the ChimeraX ToolShed (for Windows and Linux - my Mac is at home, so it'll be a bit later). I haven't exposed the Q-Score implementation to the GUI or command-line at this stage, but it's there for testing via the shell (Tools/General/Shell). To just run a quick test (opens 6out and its map, does the calculation and plots average Q-score vs. residue number for each chain) do:
from chimerax.isolde.validation.qscore import test_q_score
test_q_score(session)
To run it (without the plotting) on any loaded model and map (assuming you've only loaded one of each):
from chimerax.map import Volume
from chimerax.atomic import AtomicStructure
m = session.models.list(type=AtomicStructure)[0]
v = session.models.list(type=Volume)[0]
from chimerax.isolde.validation.qscore import q_score
residue_map, per_atom_scores = q_score(m, v)
comment:22 by , 3 years ago
Interesting that you measured this variation. I guess it’s because there is some variation/noise at each radius depending on where you put the points. Technically it’s an inaccuracy then, and this noise is not being ‘overcome’. I actually never measured this, and because the procedure I use is deterministic, it does give the same answer, but as they say, ignorance is bliss.

Would it be possible to try your method with a larger N, say 16, or 20? I settled on 8 because of speed, but maybe because your method is faster, we can try a larger N and see what happens? More samples and averaging should overcome the noise a bit better I would think...

Greg
follow-up: 17 comment:23 by , 3 years ago
Sure. Just do:
q_score(m, v, points_per_shell=N)
Personally I don't necessarily think that level of noise in the measurement is a huge problem - but it's still nice to know it exists! One thought I had was that rather than using a larger number of points per shell, if you wanted a nice publication-quality plot (as opposed to the quick check on a "model in progress" that I'm mostly after) you could run the calculation 3-5 times then plot using some approach that visualises the spread.
follow-up: 18 comment:24 by , 3 years ago
Urgh... call should be:
residue_map, per_atom_scores = q_score(m.residues, v)
Sorry about that.
follow-up: 19 comment:25 by , 3 years ago
Great progress Tristan!

Should it be in the standard ChimeraX distributions or in ISOLDE or a separate bundle on the Toolshed? And where should the source code live?

You are the one who wrote the source code, so you get to maintain it.  Probably best to put it in your own separate git repository.  Maybe make a command for it and put a separate bundle on Toolshed.  And we could also put it in the standard ChimeraX distribution.  Surely you would want people who get ISOLDE to automatically get it with out doing a separate install.
comment:26 by , 3 years ago
Well... gives me a good chance to get my head around the new .toml bundle specification scheme, I guess!
Now living at https://github.com/tristanic/chimerax-qscore. Very bare-bones right now - the command just prints the overall average Q-score for the selected residues to the log. Will build out to add a GUI (per-residue plot, click-to-view selection, etc.).
Will need a little finesse when it comes to handling Clipper's maps - crystallographic maps will need to be expanded to cover the selection before the calculation is applied, since for those the ChimeraX Volume only encompasses the currently-displayed region plus a little padding. Also it'll need to make different calls to show selected residues in context from the plot for Clipper Volumes, for similar reasons. I'll avoid making Clipper a hard dependency, but will add some code to see if (a) Clipper is installed, and (b) the volume in question is managed by Clipper, and take different actions accordingly.
comment:27 by , 3 years ago
Sounds like a reasonable plan to handle X-ray maps that may need to be extended by symmetry to cover the atoms where q-score is being computed. I think the most basic handling should just check and give an error saying the atoms are not covered by the map. The "volume cover" command can produce the covering map in some cases.
follow-up: 22 comment:28 by , 3 years ago
Current behaviour: if the model and map are *not* associated by Clipper, it will work with them as they are. Residues with any atoms outside the map bounds will be excluded from the calculation, with a warning printed to the log listing the affected residues (prettified by concise_residue_spec()). If they *are* associated by Clipper, it will run the command "clipper isolate {residue spec}" before going further. That ensures any X-ray maps will always be covering the target residues. I thought about doing it *only* for X-ray maps, but then figured that for consistency all Clipper maps should behave the same way.
comment:29 by , 3 years ago
OK, the GUI tool is at what I'd call the "minimum usable" stage now. Drop-down menus to select model and map (if the model is managed by Clipper, the map list will be split into (a) models associated with the selected model, (b) "free" maps not associated with anything, and (c) maps associated with a different model). Recalculate button triggers Q-score calculation for the whole map and model. Plot (zoomable and scrollable in the X axis) shows the results for one chain at a time, and clicking in the plot takes you to the corresponding residue (picker is insensitive to y value, and looks +/- 1 in the x (residue number) axis). As far as I can tell, everything currently behaves sensibly in the face of model, map or residue deletion.
Plenty more I can think of to improve it, but I wonder if at least some of this can be done in a collaborative manner? For instance, handling the details of visualisation when clicking on a given residue in the plot. When the model is handled by Clipper that's easy - simply "view {selection}" is generally enough. For other use cases, though, it's a bit more complex - have to decide how (and how much) to draw the cartoon, choose atom displays, mask the map, etc.. At the moment (at https://github.com/tristanic/chimerax-qscore/blob/b5eee5fc52766debf324b53a352c3a058cd48340/src/ui.py#L291) I'm just doing "view {selection}"...
A few other value-add ideas I can think of:
- shade the plot background with colours indicating helix, sheet, coil, nucleic and ligand
- recognise when the model has changed (atoms added/deleted or moved) or the volume values have changed (e.g. in Clipper's live crystallographic maps) and notify the user that they should recalculate
- options to show backbone-only or sidechain-only scores
- an adjustable sliding-average window
- option to run the calculation n number of times and plot with confidence intervals
comment:30 by , 3 years ago
That all sounds like great progress. What do you want done in a collaborative manner? Is this new tool something you want to get into the ChimeraX 1.6 release next month? Today we are supposed to git branch for ChimeraX 1.6 and make release candidates.
follow-up: 25 comment:31 by , 3 years ago
I don’t think there’s any need to rush it into the 1.6 release unless you
want to. It could just as easily live as an optional bundle on the ToolShed
for now, with ISOLDE declaring it as a dependency just like it does Clipper.

The most immediate thing that I was thinking of was that first point:
handling visualisation of standard (non-Clipper) maps/models when clicking
an entry in the plot. I think those choices are probably best made by
someone who *doesn’t* spend all their time working in Clipper/ISOLDE.

Also: I *think* I’ve gotten it right, but I’m not absolutely certain that
the q_score calculation will work correctly if the map has a non-identity
position. A sanity check on that would be most welcome!

Beyond that, things get a little more open-ended. Really as much or as
little as you like.

On Wed, 22 Mar 2023 at 18:39, ChimeraX <ChimeraX-bugs-admin@cgl.ucsf.edu>
wrote:
comment:32 by , 3 years ago
Should be a trivial build from the repo code if you want to give it a try.
The only thing you might have to do is change the ChimeraX directory in the
Makefile (or make_win.bat) - the system I settled on for daily build vs
release is slightly different from yours.

On Wed, 22 Mar 2023 at 18:51, Tristan Croll <tcroll@altoslabs.com> wrote:
follow-up: 27 comment:33 by , 3 years ago
Maybe Greg Pintilie would be interested in showing this at the May cryoEM workshop at SLAC.
comment:34 by , 3 years ago
Indeed great progress Tristan! I will try to contribute to this, may be a bit slow at first as I’m still getting used to chimeraX.

On thing is I’m getting a bit concerned if it’s not giving the same answer with the original implementation, and I’m not quite sure how this would be received, possibly not too well. Will have to think about this a bit and play around with the implementation perhaps.

As you may have noticed, and instead of the random-y k-means approach, I used a function that spreads points on a sphere approx. evenly, and it can work with any N you give it. It may even be faster than doing k-means. I think it’s called the Fibonacci sphere - just found this out yesterday, it was in a presentation at a conference. As I dive into the plugin, I may try to switch to something like this to see if it starts giving more of the same answer...
comment:35 by , 3 years ago
OK - I've created a new branch (imaginatively named "deterministic") that
takes a fully-deterministic approach to selecting shell points. Both
options are still available, switchable via the GUI. Answers still won't be
exactly the same as yours, but they *are* exactly the same from run to run.
Instead of randomly choosing the seed points for the k-means clustering,
this approach starts with a set of vertices generated by
`sphere_geometry2(2*points_per_shell-4)`. Using these directly would lead
to some (often many) empty clusters (and hence fewer than
`points_per_shell` points) - to avoid that, the "real" starting centroids
are chosen by the following algorithm:

{{{
for each seed point:
    rank all the input points by angular distance on the unit sphere
    for each ranked point:
        if not in the list of seed centroids, add it to the list and break

move on to the k-means clustering
}}}

That step's done in C++ for speed. Still costs an extra couple of seconds
for the 6out case (15-16 vs 13-14s).

To be clear, the "random" approach isn't *entirely* random - rather, for
each shell it will choose randomly from a fairly small set of stable
solutions to the clustering problem (chosen points are always part of the
input set). Anyway, I think it makes sense to keep both options available,
as long as the difference is clearly documented.

On Thu, Mar 23, 2023 at 5:15 AM ChimeraX <ChimeraX-bugs-admin@cgl.ucsf.edu>
wrote:
comment:36 by , 3 years ago
After checking that all was working correctly, I went ahead and merged that back to the main branch.
follow-up: 31 comment:37 by , 3 years ago
Good approach! I think this will be better received to get the same answer each time. As you showed the variation and difference is not huge from your numbers anyway. I will be trying this out hopefully in the next few days, just got back from the conference so should have more time now.

Greg
follow-up: 32 comment:38 by , 3 years ago
I agree with Greg that the deterministic approach is best for users. The uniformly spaced points created by the spiral sphere code does a very good job of uniformly distributing the points. It is very unlikely you will get that level of uniformity from clustering on randomly chosen points. It is interesting to see the variation in the scores with different sets of points. I think a better way to do that would be to apply a random rotation to the spiral sphere points, maybe based on random seed given as a command option so that is also reproducible. The distribution of points is only one source of variability. The shell radii of the algorithm would of course also give varying results. I think the variability is an interesting feature for the method development, but not something you need to expose to the users, unless the variability is quite high.
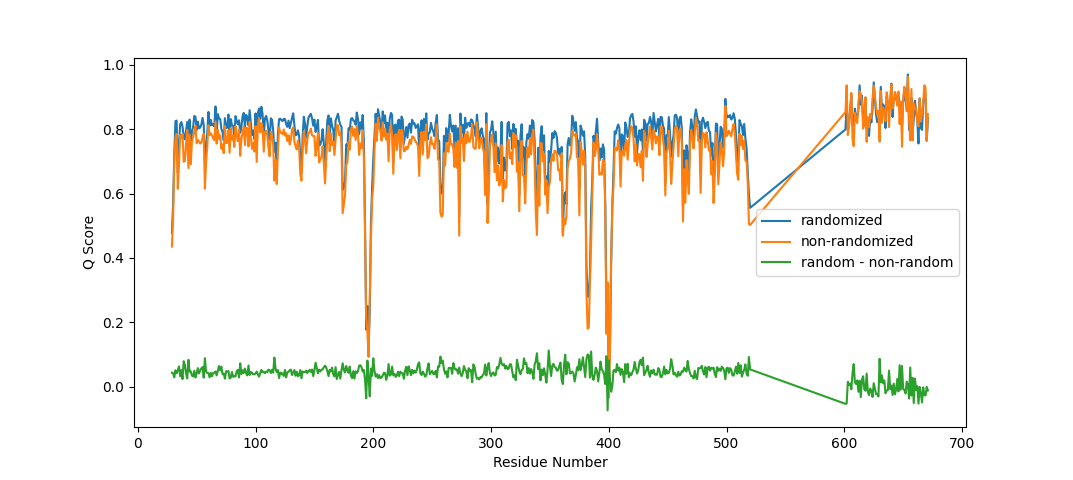
follow-up: 33 comment:39 by , 3 years ago
  It is very unlikely you will get that level of uniformity from clustering
on randomly chosen points.

Somewhat counter-intuitively, that turns out not to be true. Looking at
what happens when, say, a bit more than half a sphere remains after culling
blocked "test" points and you have 8 uniformly-distributed seed points:

- the seed points out in "unblocked" space end up dominating large clusters
- the points in "blocked" space are shifted to the nearest remaining test
points, where they're only able to "steal" a few points from the ones
described above.
- the big clusters dominate the k-means clustering - ultimately you end up
with few widely-spaced points covering the "uninhibited" space, and more
tightly-packed points around the junctions with other atoms' spaces.

I did try your random-rotation suggestion, but it really blew out the time
cost to about double the overall run time - I'm sure this could be improved
upon, but instead I ran with your idea of using a defined random seed
(argument `random_seed`), and applied it to the "randomly choose seed
centroids" approach. The new version of the C++ method takes a random seed
argument - given the same random seed, for a given number of test points
and number of points to choose, it will always choose the same subset of
points. The seed passed to the function is (`random_seed` +
`shell_number`), so for a given atom and map it should always return the
same answer for the same input seed, regardless of what selection is being
analysed. Runs at essentially the same speed as the original random
approach (about 15% faster than when pre-defined centroid points are
provided).

Overall I think it's worth it - as per the attached comparison, it gives a
slightly higher (~+0.04) Q-score to almost all protein residues, which I
put down to more uniform sampling of the "unhindered" density. For waters
(right hand end of the plot) the differences between the two approaches are
clustered close to zero.


On Thu, Mar 23, 2023 at 8:52 PM ChimeraX <ChimeraX-bugs-admin@cgl.ucsf.edu>
wrote:
follow-up: 34 comment:40 by , 3 years ago
Ok. I think I don't understand what distribution of shell points is desired. But it sounds like you do.
Is the plan to put the tool on the ChimeraX Toolshed? It could also become part of ChimeraX daily builds which might lead more people to use it, especially if we tweeted an example.
follow-up: 35 comment:41 by , 3 years ago
I’m happy with the latter approach if you are.

On Fri, 24 Mar 2023 at 17:32, ChimeraX <ChimeraX-bugs-admin@cgl.ucsf.edu>
wrote:
comment:42 by , 3 years ago
OK - I think the version on the dev branch is now very close to what I'd be
happy to call a 1.0 release. Added some basic visualisation for standard
(i.e. non-Clipper) models/maps akin to that in the Chimera plugin, added
different plot options (whole-residue, worst atom, backbone, sidechains,
ligands), tightened up various behaviours, and added some documentation to
the API (still no HTML docs, though). Quick video demo at
https://drive.google.com/file/d/1nkXR22d0TGA8xppvsy7Z6ZIe4eqOAtGc/view?usp=share_link
(first for standard map/model, then after converting it to Clipper). Note
that the Windows screen capture doesn't capture drop-down menus, but they
were there!

On Fri, Mar 24, 2023 at 5:52 PM ChimeraX <ChimeraX-bugs-admin@cgl.ucsf.edu>
wrote:
comment:43 by , 3 years ago
Current builds attached, to make it easier to try them out. Greg: to
install, just do "toolshed install {drag-and-drop the .whl file for your OS
onto the command line}" in ChimeraX. Tool appears under
Tools/Validation/Model-map Q-Score.

On Mon, Mar 27, 2023 at 4:45 PM ChimeraX <ChimeraX-bugs-admin@cgl.ucsf.edu>
wrote:
comment:44 by , 3 years ago
The demo looks amazing, I am super impressed. I like the points display, clicking on points to zoom to the residue, etc. ‘Worst atoms’ is a pretty clever option too! This should be very useful.

Greg
comment:45 by , 3 years ago
Also, I agree this could easily be a v1.0 release, and putting the demo out on twitter would be pretty cool to let others know! I fully support it and am glad to get more awareness on this, especially now that EMDB is including it in validation reports. I may slowly try to get up to date and do more testing and maybe be able to contribute but for now I’d say just get it out there and see what others think too.
follow-up: 37 comment:46 by , 3 years ago
I haven't had a chance to try it yet. Do you want this to be in the ChimeraX 1.6 release planned for the end of April? I know I asked before and you said daily build and not 1.6, but it sounds like lots of progress has been made. A lot more people will get the 1.6 release than daily builds. If we put it into ChimeraX 1.6 it probably should also be on Toolshed for updates if you expect you will want to update it sooner than 6 months from now when we would release 1.7.
comment:47 by , 3 years ago
I think it would make sense for it to go in to the release, if you're
willing.

On Mon, Mar 27, 2023 at 8:38 PM ChimeraX <ChimeraX-bugs-admin@cgl.ucsf.edu>
wrote:
follow-up: 39 comment:48 by , 3 years ago
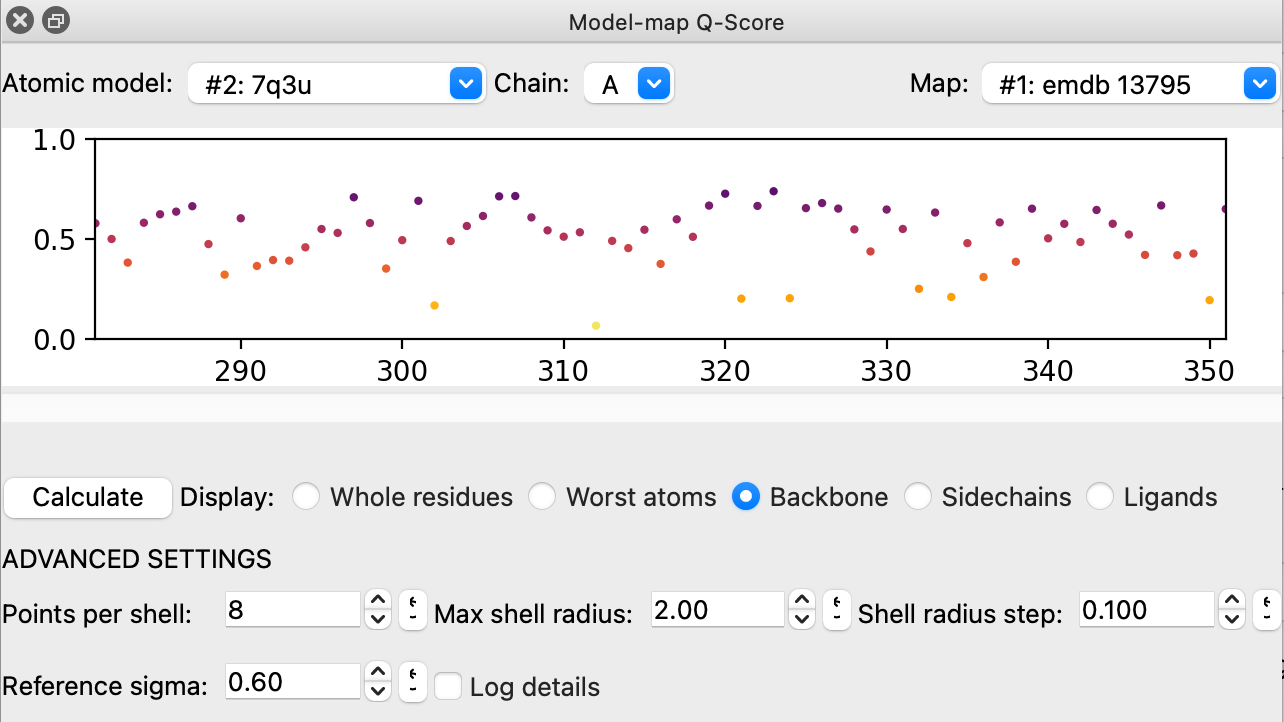
Ok, I tried qscore.  If we put it in the release we need some documentation for it -- everything in the release has documentation.  Also A few suggestions.

1) Might be nicer to have a Chain menu in the upper left corner.  Current the atomic model menu in the upper left corner and chain menu in the lower right corner is odd.
2) The current atomic model menu entry just says "#1".  I think all ChimeraX menus that show models show the name and the id number -- that helps the user.  There is ui.widgets menu support for that.  Also the map menu says "#2".  Again these id numbers are meaningless to the user so all ChimeraX map menus show map name and id number.
3) The slider under the plot strangely confused me because I could not move it and it looks grayed out.  I see that is because it was showing all residues.  Also it confused me because on Mac when click within the left half of the slider circle it doesn't grab it or move when only a subset of residues are shown.  Only works when I click in the right half of that circle.  Don't ask how I figured that out.
4) Clicking the Ligands checkbutton threw an error for PDB 7q3u and emdb 13795.  Reported a bug, will be assigned in a minute.
5) When I had Backbone checked I was and clicked on a plot dot it showed the ribbon residue.  I hid atoms, and click again and it insists on showing the ribbon.  Doesn't seem could if I'm trying to assess the fit of the backbone atoms.  I would think the tool should assure the chosen atoms are shown but not be enabling cartoon -- let the user do that.
6) The Recalculate button was a bit weird.  It made me think the tool was broken because the plot showed nothing.  Maybe just call it "Calculate".
comment:49 by , 3 years ago
| Cc: | added |
|---|
Elaine. We are thinking of adding the qscore tool to ChimeraX 1.6. It was part of Segger in Chimera. But Tristan has made a separate ChimeraX qscore tool. It measures how well each atom fits in EM or X-ray density maps.
comment:50 by , 3 years ago
Most of that looks straightforward. I wasn't entirely happy with the slider
behaviour either (it's a MatPlotLib Slider object built into the plot
area). Will probably replace it with a QSlider - they seem much neater in
general. To make the command-line version more useful, I should probably
make it display the GUI (if it's not already displayed) and give it the
option to write the results to a file.

On Mon, Mar 27, 2023 at 9:44 PM ChimeraX <ChimeraX-bugs-admin@cgl.ucsf.edu>
wrote:
follow-up: 41 comment:51 by , 3 years ago
I agree the command-line version should show the gui by default.  But make it an option so people can use it in a nogui script where they just write scores to a file.

If the polishing is too much work I'd suggest not rushing it to make the 1.6 release.  We can put it in daily builds and of course on Toolshed.
follow-up: 42 comment:52 by , 3 years ago
Yeah, it might be a bit of a stretch. I can probably afford one more solid
day on it before I have to move on to other things for a while.

On Mon, 27 Mar 2023 at 22:08, ChimeraX <ChimeraX-bugs-admin@cgl.ucsf.edu>
wrote:
follow-up: 43 comment:53 by , 3 years ago
Apart from the HTML documentation, all Tom’s points are now addressed
(albeit not yet pushed to the repo). One thing I can think of that will
stay in the too-hard basket for now is residues with insertion codes -
residues with the same number but different insertion codes will end up
stacked vertically in the scatter plot, and I’m not sure which one clicking
will select.

Will push everything later this evening but will have to leave it for the
time being after that - have to prepare for a workshop next week.

On Mon, 27 Mar 2023 at 22:12, ChimeraX <ChimeraX-bugs-admin@cgl.ucsf.edu>
wrote:
comment:54 by , 3 years ago
All pushed. Also added some basic documentation (doc for the command is
reasonably complete and links up; doc for the tool is just a stub, and to
be perfectly honest I've completely forgotten how to make that
automatically link up in the ChimeraX help browser). Done as a Sphinx
project (rst source lives in docs/source; to build the html docs you need
to have already installed the bundle into ChimeraX - then "make docs"
followed by "make install" should do it). Sorry, but now I'm completely out
of time to continue on this for at least the next fortnight.

On Tue, Mar 28, 2023 at 3:46 PM ChimeraX <ChimeraX-bugs-admin@cgl.ucsf.edu>
wrote:
follow-up: 44 comment:55 by , 3 years ago
OK, I lied. :) Couldn't resist doing a little more polishing this morning
(adding some controls to the GUI for the settings covered by the command).
I think it's ready to put on the ToolShed - I just submitted the Windows
wheel. Looks like I have to wait until it's approved until I can upload the
Mac and Linux builds.

On Tue, Mar 28, 2023 at 5:41 PM ChimeraX <ChimeraX-bugs-admin@cgl.ucsf.edu>
wrote:
comment:57 by , 3 years ago
Thanks! All three builds are now up on the ToolShed.

On Wed, Mar 29, 2023 at 4:30 PM ChimeraX <ChimeraX-bugs-admin@cgl.ucsf.edu>
wrote:
follow-up: 47 comment:58 by , 3 years ago
Great! Coming in my building at work this morning a grad student asked me "What is the QScore tool I heard about on Twitter?"! I'll give the new Toolshed version of spin.
follow-up: 48 comment:59 by , 3 years ago
Tried the toolshed 1.0 qscore. Here are a few suggestions. I realize you are busy for some weeks. These suggestions are polish, nothing critical.
1) Make the atomic model and map menus have a value initially selected. I had one map (emdb 13795) and one model (7q3u) open the menus are set to None. The software should not waste the user's time. Even if multiple atomic models and maps are open choose one in the menu and it may be the right one.
2) When I show backbone atom scores and click a plot dot it selects the entire residue. Would be nicer to select just the backbone atoms. Same with Worst atoms, Side chains.
3) Would be nice to hide ADVANCED SETTINGS and have an Options button.
4) The row of radio buttons and Calculate button are wider than the standard right column window width (on Mac) which causes all tools to resize wider. Would be nice to stay within the standard width. I suggest putting buttons Calculate, Options, Help on a bottom row and the radio buttons on the row above those buttons.
5) The reset to default value buttons in advanced settings are too narrow on Mac and so the icon is clipped so much it is unrecognizable (image attached).
6) The number entry fields in the advanced settings are twice as wide as necessary. Nice to make them a width that matches the maximum sensible numeric value precision.
comment:60 by , 3 years ago
Thanks for putting QScore on the Toolshed. I still like the idea of putting it in ChimeraX distributions by default, but think we should not rush it. I suggest not putting it in ChimeraX 1.6 where release candidates are already out until QScore gets a bit of use and the UI is cleaned up to make the best impression with users.
by , 3 years ago
| Attachment: | qscore_gui.png added |
|---|
Image of GUI of QScore 1.0 on Toolshed March 29, 2023.
follow-up: 50 comment:61 by , 3 years ago
... huh. Those reset buttons are indeed pretty ugly. Looked fine on my Mac. The fiddly details of Qt can be a little painful sometimes!
I thought about hiding the advanced settings as well, but then decided it would be best to keep them visible (with a clear visual indication for any non-default values). My reasoning was that the Q-Score is now part of the official wwPDB validation report for cryo-EM models... while it's good to give users the freedom to experiment with different settings for their own purposes, it's also important to make sure they can't forget when they've deviated from the official parameters.
Anyway, will try to find the time for some more polishing when I can.
follow-up: 51 comment:62 by , 3 years ago
In general I tailor ChimeraX user interfaces for the competent researcher and don't make the user interface painful to protect them from themselves. For the Q-score advanced options, showing those is also an invitation to change values that should probably not be changed by anyone unless they are researching the scoring algorithm itself.
follow-up: 52 comment:63 by , 3 years ago
Or put the "shoot yourself in the foot" controls under an "Advanced Settings" disclosure triangle.

--Eric
follow-up: 53 comment:64 by , 3 years ago
I was thinking I could put some sort of “generated with on-default
settings“ indirect on the plot itself. Then it wouldn’t matter if those
controls are hidden.

On Fri, 31 Mar 2023 at 23:16, ChimeraX <ChimeraX-bugs-admin@cgl.ucsf.edu>
wrote:
follow-up: 54 comment:65 by , 3 years ago
I would like to start looking and hopefully working with the q-score plugin…

What should my approach be? I assume make a branch and work with that?

Just to start playing around, I started by cloning the repo:
git clone https://github.com/tristanic/chimerax-qscore.git

How would I then build and install this?

I tried naively what is mentioned in the tutorial, i.e. "devel build /Users/greg/chimerax-qscore/“, but then ChimeraX quits (or maybe crashes).

I noticed there is C code in there, so I guess there is a more involved build? Can it be done on a Mac or do I have to do it on Windows with Visual Studio, I think the tutorial mentions this…

Greg


On Mar 31, 2023, at 3:21 PM, ChimeraX <ChimeraX-bugs-admin@cgl.ucsf.edu<mailto:ChimeraX-bugs-admin@cgl.ucsf.edu>> wrote:

#8646: Map-fit scoring
------------------------------------+-------------------------
         Reporter:  Tristan Croll  |      Owner:  Tom Goddard
             Type:  enhancement    |     Status:  assigned
         Priority:  normal         |  Milestone:
        Component:  Volume Data    |    Version:
       Resolution:                 |   Keywords:
       Blocked By:                 |   Blocking:
Notify when closed:                 |   Platform:  all
          Project:  ChimeraX       |
------------------------------------+-------------------------

Comment (by Tristan Croll):

{{{
I was thinking I could put some sort of “generated with on-default
settings“ indirect on the plot itself. Then it wouldn’t matter if those
controls are hidden.

On Fri, 31 Mar 2023 at 23:16, ChimeraX <ChimeraX-bugs-admin@cgl.ucsf.edu<mailto:ChimeraX-bugs-admin@cgl.ucsf.edu>>
wrote:

}}}

--
Ticket URL: <https://www.rbvi.ucsf.edu/trac/ChimeraX/ticket/8646#comment:64>
ChimeraX <https://www.rbvi.ucsf.edu/chimerax/>
ChimeraX Issue Tracker
follow-up: 55 comment:66 by , 3 years ago
I guess the best way would be to make your own fork to work on, and send
any changes you like back as pull requests. In terms of building, you'll
need XCode installed on the Mac, and Visual Studio in Windows (ChimeraX
itself is built with VS 2017, but using a later version shouldn't actually
make a difference in this case). On Linux, as long as you're just building
to test on your own machine you'll be fine with the system compiler, but
builds for distribution need to be done in a CentOS 9 environment (I use a
Singularity container) to make sure they'll run on all the systems ChimeraX
runs on. In terms of actually building, there's a Makefile usable in Mac
and Linux (and presumably in Windows under cygwin, but I don't use that
personally). It's mostly just a very thin wrapper for the command:

chimerax --nogui --exit --cmd "devel install ."

If you just do "make install" it'll look for a ChimeraX daily build
(chimerax-daily on the PATH in Linux;
/Applications/ChimeraX-daily.app/Contents/bin/ChimeraX on the Mac);
"RELEASE=1 make install" will instead use ChimeraX from the expected
location of a release version. For Windows, I use a simple batch file
(make_win.bat) - "make_win app-install" or "make_win release app-install".Re

The above will rebuild any stale C++ code, bundle everything into a wheel
in the dist/ directory, and install it into ChimeraX.

On Thu, May 11, 2023 at 9:10 PM ChimeraX <ChimeraX-bugs-admin@cgl.ucsf.edu>
wrote:
follow-up: 56 comment:67 by , 3 years ago
Thanks for the quick response Tristan!

I am trying to build it on Mac… I guess I need to install pybind somehow, I got:

src_cpp/_kmeans_cpp/spherical_k_means.cpp:9:10: fatal error: 'pybind11/pybind11.h' file not found
#include <pybind11/pybind11.h>

Any pointers? I will google around a bit…

Greg
follow-up: 57 comment:68 by , 3 years ago
Looks like "brew install pybind11” was all it takes… seems to build fine now.

Greg


On May 11, 2023, at 1:38 PM, ChimeraX <ChimeraX-bugs-admin@cgl.ucsf.edu<mailto:ChimeraX-bugs-admin@cgl.ucsf.edu>> wrote:

#8646: Map-fit scoring
------------------------------------+-------------------------
         Reporter:  Tristan Croll  |      Owner:  Tom Goddard
             Type:  enhancement    |     Status:  assigned
         Priority:  normal         |  Milestone:
        Component:  Volume Data    |    Version:
       Resolution:                 |   Keywords:
       Blocked By:                 |   Blocking:
Notify when closed:                 |   Platform:  all
          Project:  ChimeraX       |
------------------------------------+-------------------------

Comment (by gregdp@…):

{{{

Thanks for the quick response Tristan!

I am trying to build it on Mac… I guess I need to install pybind somehow,
I got:

src_cpp/_kmeans_cpp/spherical_k_means.cpp:9:10: fatal error:
'pybind11/pybind11.h' file not found
#include <pybind11/pybind11.h>

Any pointers? I will google around a bit…

Greg


}}}

--
Ticket URL: <https://www.rbvi.ucsf.edu/trac/ChimeraX/ticket/8646#comment:67>
ChimeraX <https://www.rbvi.ucsf.edu/chimerax/>
ChimeraX Issue Tracker
comment:69 by , 3 years ago
That's one way of doing it - but pybind11 is also attached to the
repository as a submodule. "git submodule init" followed by "git submodule
update"  in the repo will pull it to extern/pybind11.

On Thu, May 11, 2023 at 9:44 PM ChimeraX <ChimeraX-bugs-admin@cgl.ucsf.edu>
wrote:
Sounds good. Greg Pintilie developed Q-score and I have worked with him for a decade or more. I guess you mean Q-score is in Chimera and you want to compare against that. That version in Chimera may be an old implementation since I have not updated Segger in Chimera is a long time. Here is Greg's version in Segger which can be installed with Chimera
I ported some of Chimera Segger to ChimeraX in 2020 but I think Greg updates Segger only for Chimera.
It would be nice if qscores could be computed in ChimeraX even when ISOLDE is not installed.
I grant you permission to use Chimera to run your Q-score comparison tests. Let's do this as efficiently as possible.