Opened 4 years ago
Last modified 4 years ago
#6616 assigned defect
DICOM lung preset doesn't play well with SEG models
| Reported by: | Elaine Meng | Owned by: | Tom Goddard |
|---|---|---|---|
| Priority: | moderate | Milestone: | |
| Component: | DICOM | Version: | |
| Keywords: | Cc: | Zach Pearson | |
| Blocked By: | Blocking: | ||
| Notify when closed: | Platform: | all | |
| Project: | ChimeraX |
Description
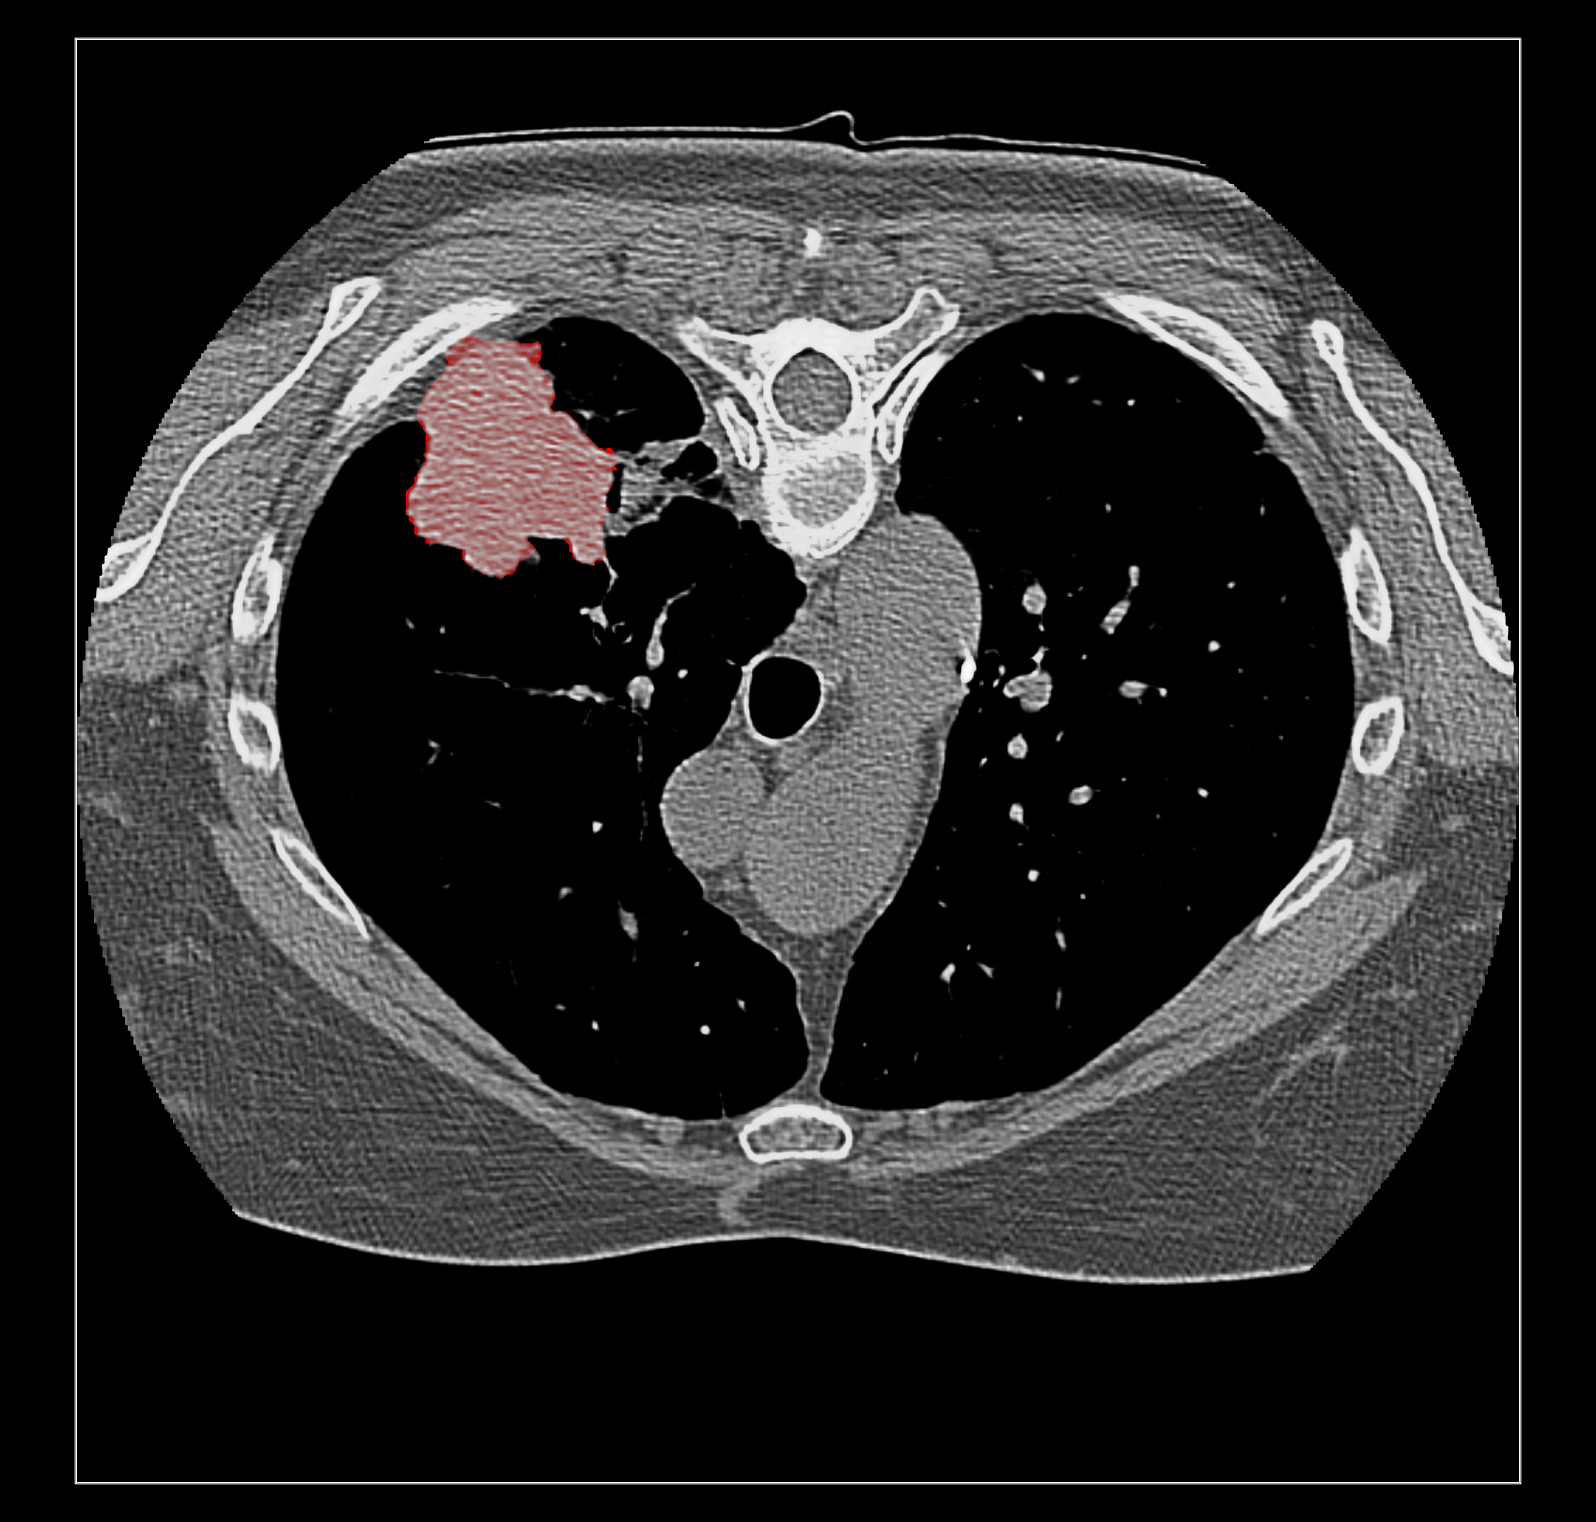
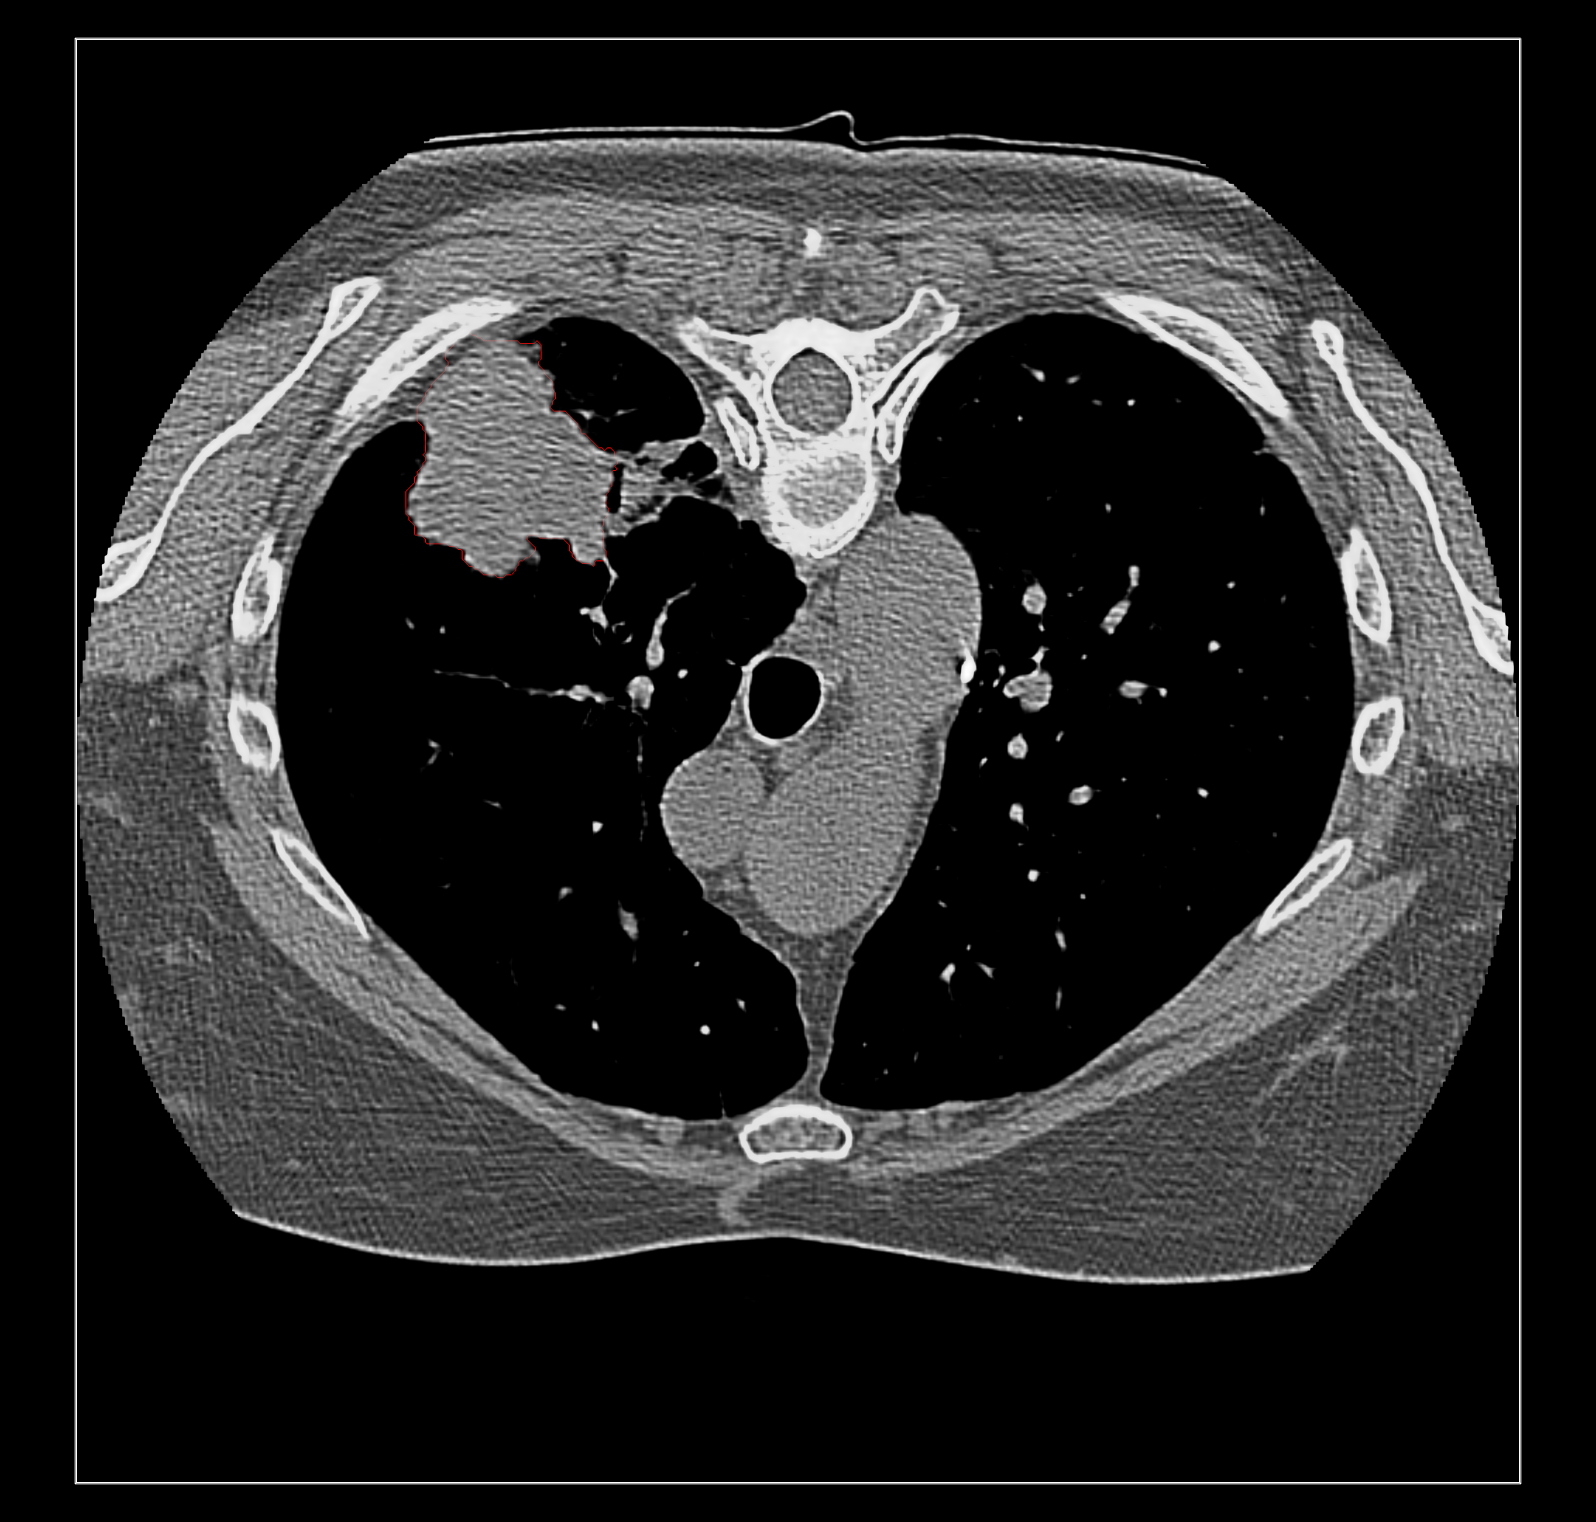
Using the DICOM lung preset with the RIDER lung datasets gives a barely visible display when SEG models are displayed along with the CT. Simply choosing full volume (rather than the initial single plane) does not have this problem when the default thresholding curve is used.
Attachments (3)
Change History (13)
comment:1 by , 4 years ago
| Component: | Volume Data → DICOM |
|---|
comment:2 by , 4 years ago
| Priority: | high → moderate |
|---|
follow-up: 3 comment:3 by , 4 years ago
By "linked" maybe you mean the dataset linked to the tutorial?  Yes, it only has one CT series.

However, there are sample data described on this page
https://www.rbvi.ucsf.edu/chimerax/dicom/examples.html

and the actual data files are in
/wynton/group/ferrin/usr.local/projects/chimerax/www/data/dicom
with a README in that directory explaining each one

Since these are also all publicly available from TCIA (among many, many more) the links on the example page simply go to TCIA.

It's a pain to move the datasets around and share all the ones I have since they are too big to be attached to email even if zipped.

Elaine
follow-up: 4 comment:4 by , 4 years ago
What I showed in group meeting, however, had even more stuff:  2 CTs and 8 SEG series, and the SEGs only go with one of the CTs and not the other. I don't know if you need that whole set of stuff, which was for one patient (and in turn, there were 32 patients in the entire RIDER Lung CT dataset), to evaluate what you want to evaluate.  It would be good if one or the other could download data from TCIA yourself.  Just requires getting a free app, and having enough space on your computer to get the data you choose.

The example file in the data dir, however, would be good enough for you if you simply wanted some SEG examples.
comment:5 by , 4 years ago
This data set on plato demonstrates the problem.
/usr/local/projects/chimerax/www/data/dicom/11-06-2014-1-96508-subset.zip
I was just trying to avoid difficult data transfers from TCIA.
comment:6 by , 4 years ago
I looked at this problem with the RIDER lung dataset from the previous comment (taken from plato). Here is what is going on.
Basically this is an image rendering limitation. If you show only the lung CT and no segmentation, say just one plane. Then the "airways" preset in the Medical Image toolbar shows fine blue lines because the brightness curve on the histogram is narrow so only a small range of intensity values are shown. The lines appear much sharper than the resolution of the image data. This beautiful result is created by the volume command colormapOnGpu option being true. It produces fine lines because each pixel on the screen interpolates into the image data and then that interpolated intensity is used to lookup the color brightness using the brightness curve on the histogram. If you turn colormapOnGpu off ("volume #1 colormapOnGpu false") the lines become a pixelated much dimmer rendering. In that mode mode the each voxel intensity is given a brightness from the curve on the histogram. Then pixels on the screen get a brightness by interpolating the nearby voxel colors. This gives a sampling and resolution set by the volume voxel size instead of the screen pixel size. The reason it is much dimmer is because the narrow brightness curve has a peak at intensity -500 and width -700 to -300. If two adjacent voxels have values -1000 and -100 then both of those have brightness 0 (outside the brightness curve peak) and if we later interpolate those two 0 brightness values it always gives 0. But in the colormapOnGpu true mode, a pixel between those two voxels gets an interpolated intensity of -500 and that translates to a high brightness.
So in summary, colormapOnGpu true gives fine pixel level sampling, while colormapOnGpu false gives coarse voxel level sampling. The individual DICOM images have colormapOnGpu true. But if two are shown then blending is done. The blending code cannot not use colormapOnGpu true,. So as soon as two volumes are shown so that blending is needed, the behavior is colormapOnGpu false.
Could this be fixed so blending used colormapOnGpu true? Not easily. The blending currently makes a new hidden volume with assigned colors for each voxel. It does not use a colormap. I don't think it is feasible to make a single colormap for the blended volume. An alternative way of blending could just render each volume channel in order one plane at a time back to front. This has numerous difficulties and limitations. One limitation is that if a red volume were blended with a green channel, then the second one (e.g. green) would always appear on top of the red. For instance if red and green were both 50% transparent then you would expect equal amounts of red and green (ie yellow). But because the green is drawn second, its opacity occludes the red but the red plane does not occlude the green, so you end up with twice as much green as red. A fancier approach could blend the different volumes to a temporary pixel resolution buffer, then render that buffer to the screen, one plane at a time. That could achieve the good quality of "colormapOnGpu true" without color artifacts.
I'd estimate the time required to implement higher quality volume blending would be about 1 month. That is too much time unless this is a heavily used feature.
The main use of volume blending in ChimeraX is for multichannel light microscopy. I've never noticed the problem reported in this ticket for blended light microscopy. There are several reasons. First "colormapOnGpu" is off by default. The brightness curves used for DICOM data are special in being narrow in width because the intensity levels (Hounsfeld units) are well calibrated and correspond to specific tissue types. The brightness curves used in light microscopy are wide and the voxel size is small (e.g. often 1024 or 2048 grid points in x,y), often comparable to screen pixel size, so the colormapOnGPU improvement is hardly noticeable.
In summary improved volume blending is difficult (about 1 month of work) and is only likely to benefit medical imaging visualization.
follow-up: 7 comment:7 by , 4 years ago
My position is that SEG models should be rendered as surface style, NOT as the volume/image style that would require some kind of fancy blending with the CT or whatever modality of data is used for the actual medical scan.
follow-up: 8 comment:8 by , 4 years ago
Surface rendering of segmentation channels avoids this problem.  But I suspect coloring the image data according to the segmentation is far more useful to researchers looking at medical imaging because unlike a surface it allows you to see the intensities in the segmented region.  For instance that helps you judge if the segmentation is correct.  Sometimes a surface is best, for instance if you just want to see the size of a segmented tumor or compare the size a month ago to now using transparent surfaces can do that.

I guess my overall assessment is that good quality medical imaging visualization needs the fancier blending.  Because medical imaging is significantly different from electron and light microscopy there will be different needs that may be hard to implement like this blending problem.  The priority of such time consuming improvements needs to be guided by medical imaging users.
follow-up: 9 comment:9 by , 4 years ago
Isn't it possible to show a surface model as a plane without capping (i.e. it would just be an outline in the plane of the CT slice)? I couldn't figure out how to do it, maybe because the SEG are submodels of the CT, which is in turn shown as the volume/image style.
follow-up: 10 comment:10 by , 4 years ago
Surface rendering of a segmentation with image rendering of a CT scan can look ok, and only the outline of the surface can be shown using volume command "capFaces false".  Showing both segmentation and CT as image also works fine if the brightness curve is not narrow.  I've attached images for all 3 styles made with

{{{
open /Users/goddard/ucsf/data/dicom/11-06-2014-1-96508-subset format dicom
volume #1.1.1.1.2 style surface
volume #1.1.1.1.2 style surface capFaces false
}}}

The capped surface flickers badly when rotating because the surface cap is at exactly the same depth as the image plane so a rendering depth fight ensues.
The surface outline is so thin on a retina display it is hard to see.  Currently we don't support thicker lines because thick line support was dropped in modern OpenGL.

The surface style with plane CT image display adjusts when the plane is moved with the slider since the CT and segmentations are grouped as multichannel volume data.


Elaine, do you have the example data set on plato? The RIDER lung data linked on the ChimeraX DICOM page does not have SEG data.