Opened 3 months ago
Last modified 3 months ago
#20142 assigned enhancement
Make a mutation score heatmap GUI
| Reported by: | Tom Goddard | Owned by: | Tom Goddard |
|---|---|---|---|
| Priority: | moderate | Milestone: | |
| Component: | Structure Analysis | Version: | |
| Keywords: | Cc: | Willow.Coyote-Maestas@… | |
| Blocked By: | Blocking: | ||
| Notify when closed: | Platform: | all | |
| Project: | ChimeraX |
Description
None of the current mutation score tools (scatter plot, histogram, color structures) give a view of all the different scores. Would be nice to have an interactive heatmap showing all the mutation scores that interacts with associated structures.
Attachments (2)
Change History (17)
comment:1 by , 3 months ago
comment:2 by , 3 months ago
I added an Options button to the heatmap gui with options to choose the colormap and to show unnormalized mutation scores.
comment:3 by , 3 months ago
Added options panel controls to choose mutation set, specify score names to include, highlight mutations with structure residues (formerly was in context menu), subtract fit. Three different colormaps are used for normalized, unnormalized, and unnormalized fit subtracted scores.
comment:4 by , 3 months ago
| Cc: | added |
|---|
Made several heatmap improvements:
Added zoom factor (pixels per cell).
Made save image include all of heatmap and axes.
Allowed mouse hover to color structure residues.
Added drag box coloring of associated residues.
Added amino acid order to options panel.
Added option to group heatmap by amino acid or score name on vertical axis.
comment:5 by , 3 months ago
Here are features I plan on implementing in the next few days or week.
Show only selected residues in heatmap.
Show heatmap x-axis labels of residue amino acid and number in vertical text.
Save heatmaps in sessions.
Be able to set all heatmap options by command.
Some other possibilities are:
Allow naming heatmaps which will remember all the settings.
Show computed residue scores in heatmap instead of per-mutation scores.
Allow coloring structures based on mutation scores for selected rectangles on heatmap.
comment:6 by , 3 months ago
Added button under Options to show only selected residues in heatmap.
Also added checkbutton to show vertical residue labels on x axis for every residue.
by , 3 months ago
| Attachment: | heatmap2.png added |
|---|
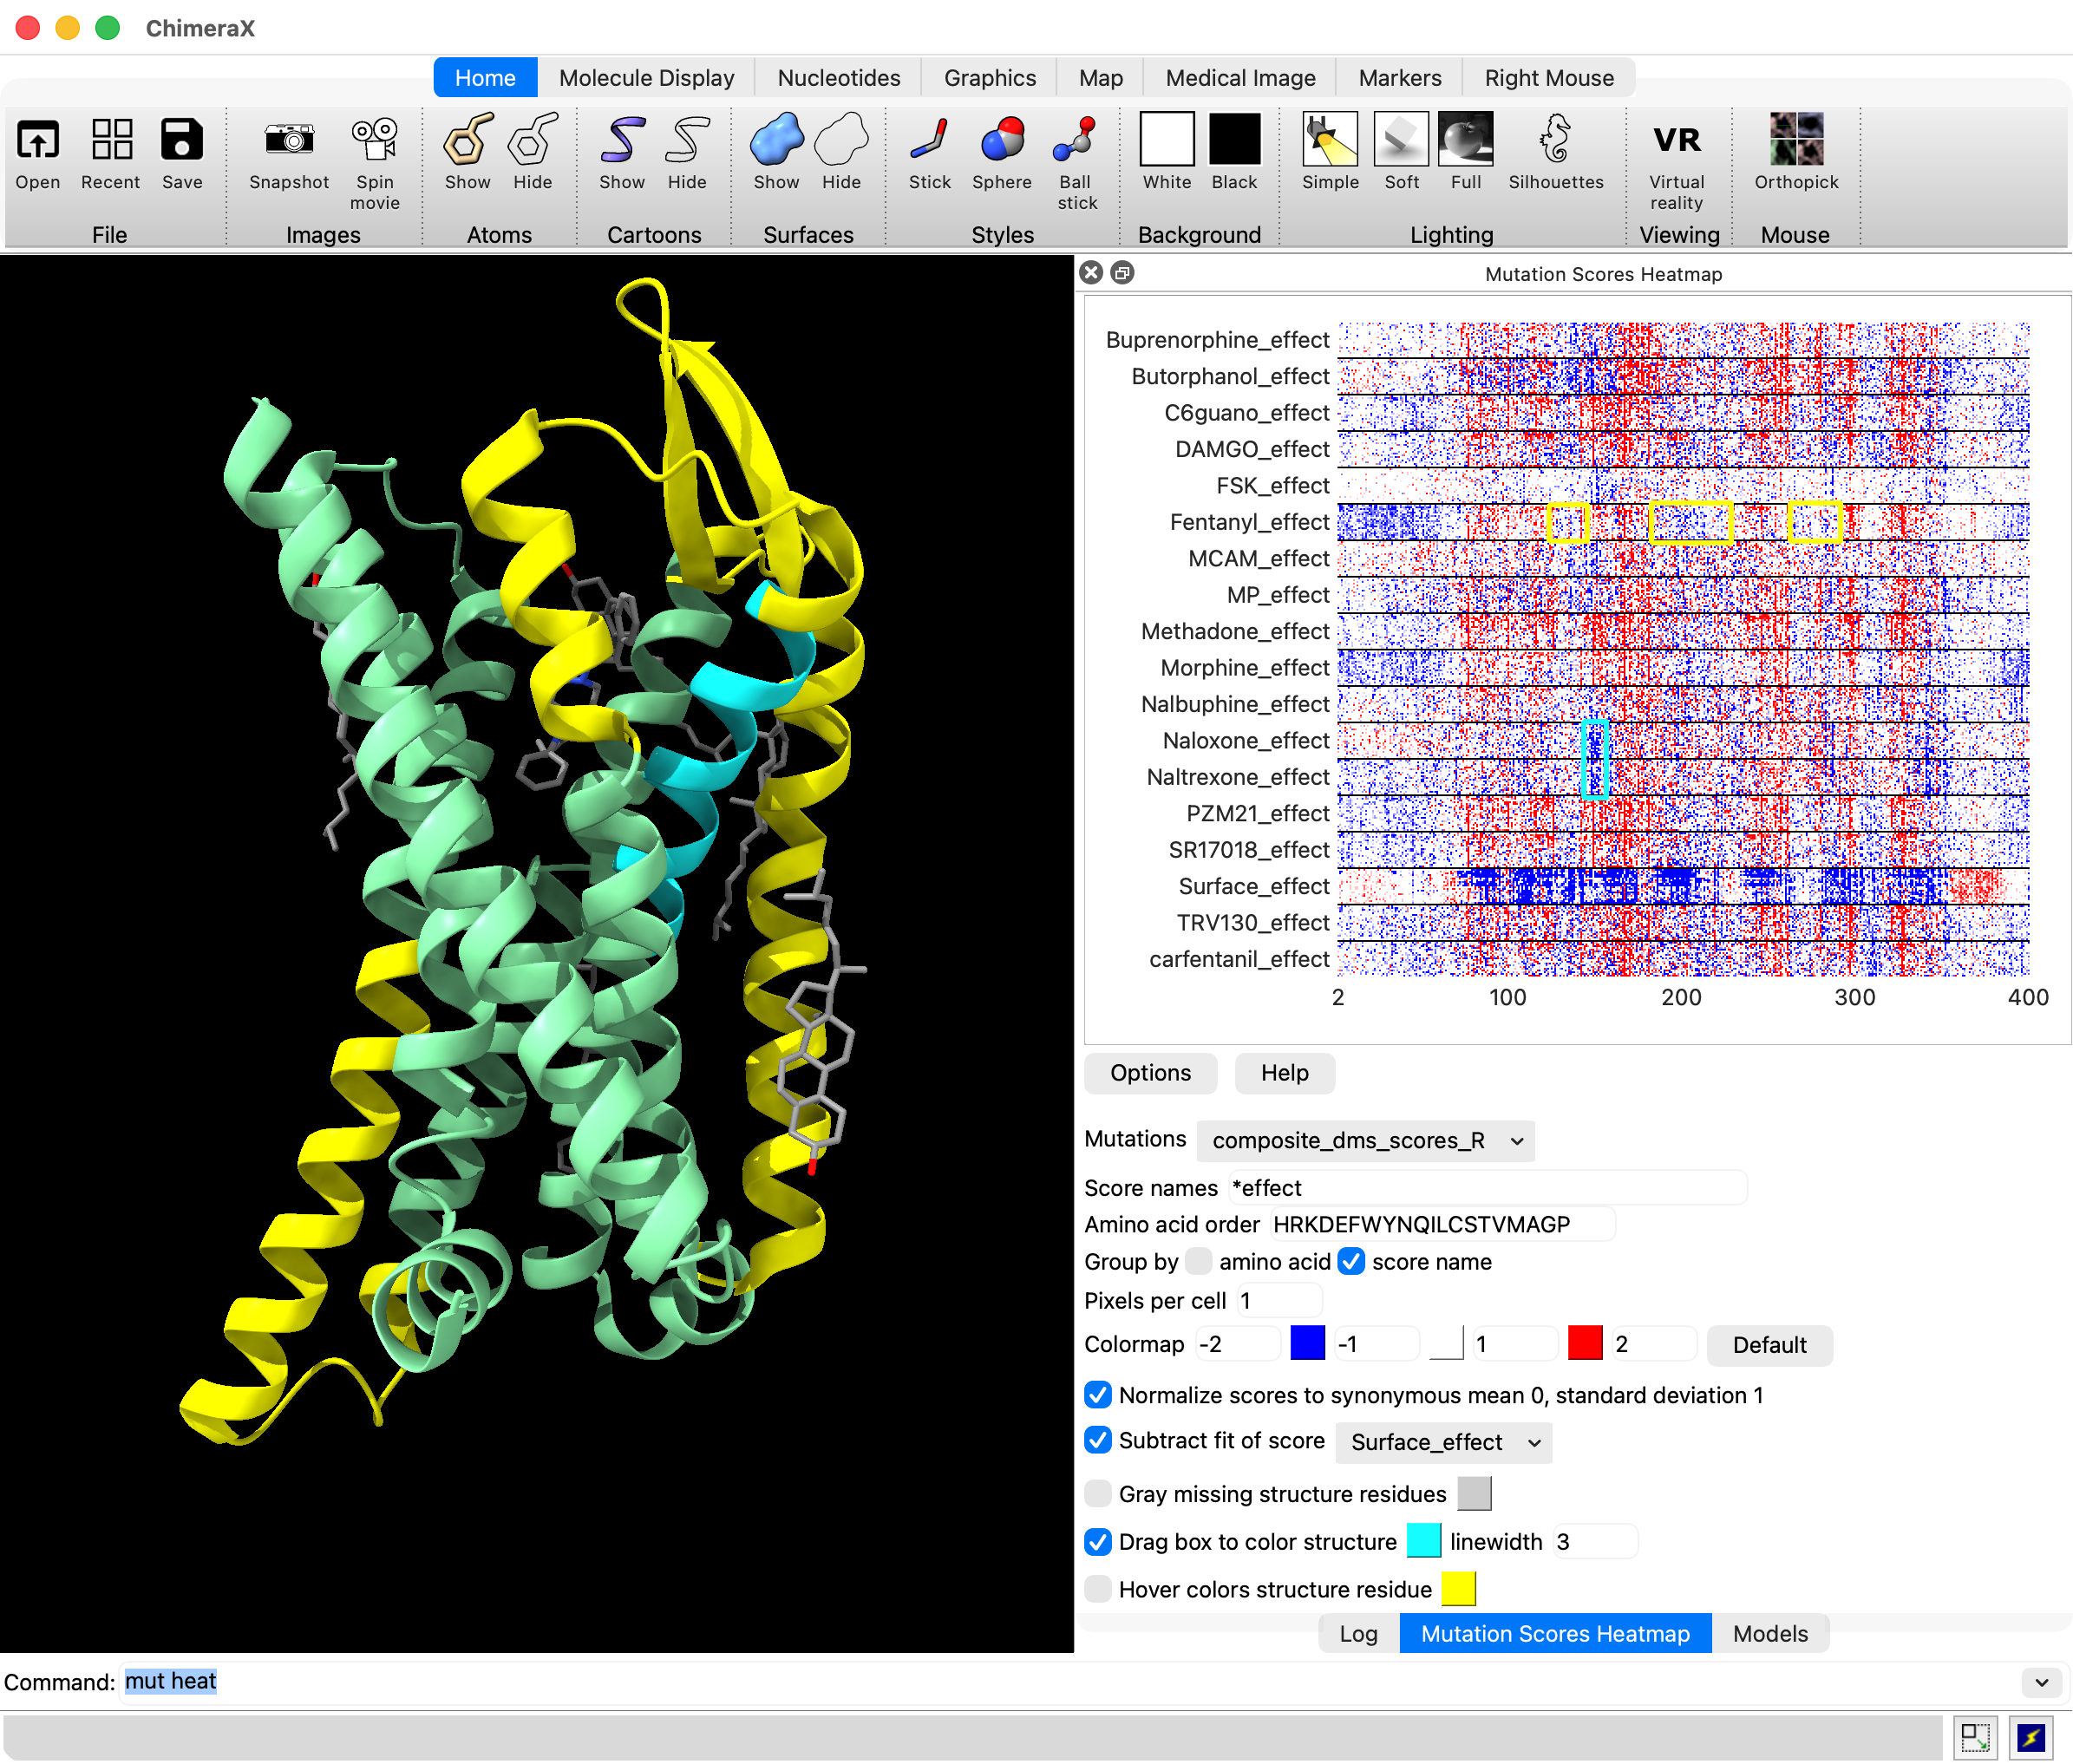
Example showing boxes dragged on heatmap to color structure residues.
by , 3 months ago
| Attachment: | heatmap3.png added |
|---|
Example showing heatmap with only selected subset of residues.
comment:7 by , 3 months ago
Added session saving for heatmaps.
Fixed heatmap normalization error when there are no synonymous scores.
Made heatmap color missing scores in a distinct color, default black.
Added options to mutationscores heatmap command for all heatmap settings.
Heatmap windows have names (by default 1, 2, 3, ...) and the heatmap command can change the settings for an existing heatmap window.
comment:8 by , 3 months ago
Added options to the "mutationscores heatmap" command for all the heatmap settings.
Automatically scale axis labels so they don't overlap each other.
Made structure amino acid sequence on x-axis show in horizontal text instead of vertical text when every residue shown.
Renamed "Pixels per cell" to "Zoom factor".
Added score names Choose button that shows a panel of checkbuttons for all score names.
comment:9 by , 3 months ago
A few more suggestions from Willow today, not yet implemented.
1) Put the heatmap x and y axis labels in separate panels so they don't disappear when scrolling the heatmap.
2) Could make horizontal divider lines between groups thicker (e.g. two cells instead of 1). Maybe instead drawing the spacers as white and adding a gray 1 pixel thick line would look sharper.
3) If two or more contiguous residue ranges shown might want vertical divider lines. Not sure how one would control this. The lines are probably not wanted if showing say selected residues in a binding site. Could have a checkbutton and the user decides whether to show a vertical divider at every non-contiguous residue jump.
comment:10 by , 3 months ago
Willow suggests:
4) Potentially when selecting regions of the heatmap it would make sense for those residues to be selected in the structures not just recolored which would allow showing the residue atoms or something else.
comment:11 by , 3 months ago
Made default heatmap zoom factor 2.
Made default grouping by score instead of by amino acid if there is more than 1 score.
Made the heatmap axis labels stay not scroll out of view.
comment:12 by , 3 months ago
Made the heatmap residue labels on the x-axis not overlap each other. The residue labels were always overlapping each other when there was a missing residue in the data because the code attempted to show the residue number for the end of each interval of contiguous residues. The new algorithm simply shows residue numbers for every 10, 20, 50, or 100 residues depending on zoom factor.
comment:13 by , 3 months ago
Show a popup window describing the mutation and score under the mouse position. This info was show below the heatmap next to the Help button before, but you had to take your eye off the mouse to see it. This popup allows you to keep your eye on the mouse.
comment:14 by , 3 months ago
Made mutation heatmap never refuse to normalize scores. Formerly if there were no synonymous scores it gave a warning and turned off normalization for all scores. Now it will use the mean/sd of all scores if there are no synonymous scores. Also if the standard deviation was 0 it formerly turned of normalization. But now it simply uses 0 for all normalized scores (since all scores have the same value, so subtracting the mean gives 0). This behavior is more friendly as it always allows you to use normalized scores.
comment:15 by , 3 months ago
I changed the option to color residues by dragging a box on the heatmap to allow selecting and/or coloring the residues. Default is to color but not select.
A basic heatmap mutation score GUI is available using command "mutationscores heatmap". There are still many features and command options to be added. Once it is more functional I plan to make opening a mutation score .csv file bring up an initial tool panel with buttons for heatmap, scatter-plot, histogram, structure coloring, and a list of currently open mutation sets.