Opened 9 months ago
Last modified 9 months ago
#19144 assigned enhancement
Make an interactive deep mutation scan trace plot
| Reported by: | Tom Goddard | Owned by: | Tom Goddard |
|---|---|---|---|
| Priority: | moderate | Milestone: | |
| Component: | Structure Analysis | Version: | |
| Keywords: | Cc: | Willow.Coyote-Maestas@…, Matthew.Howard@… | |
| Blocked By: | Blocking: | ||
| Notify when closed: | Platform: | all | |
| Project: | ChimeraX |
Description
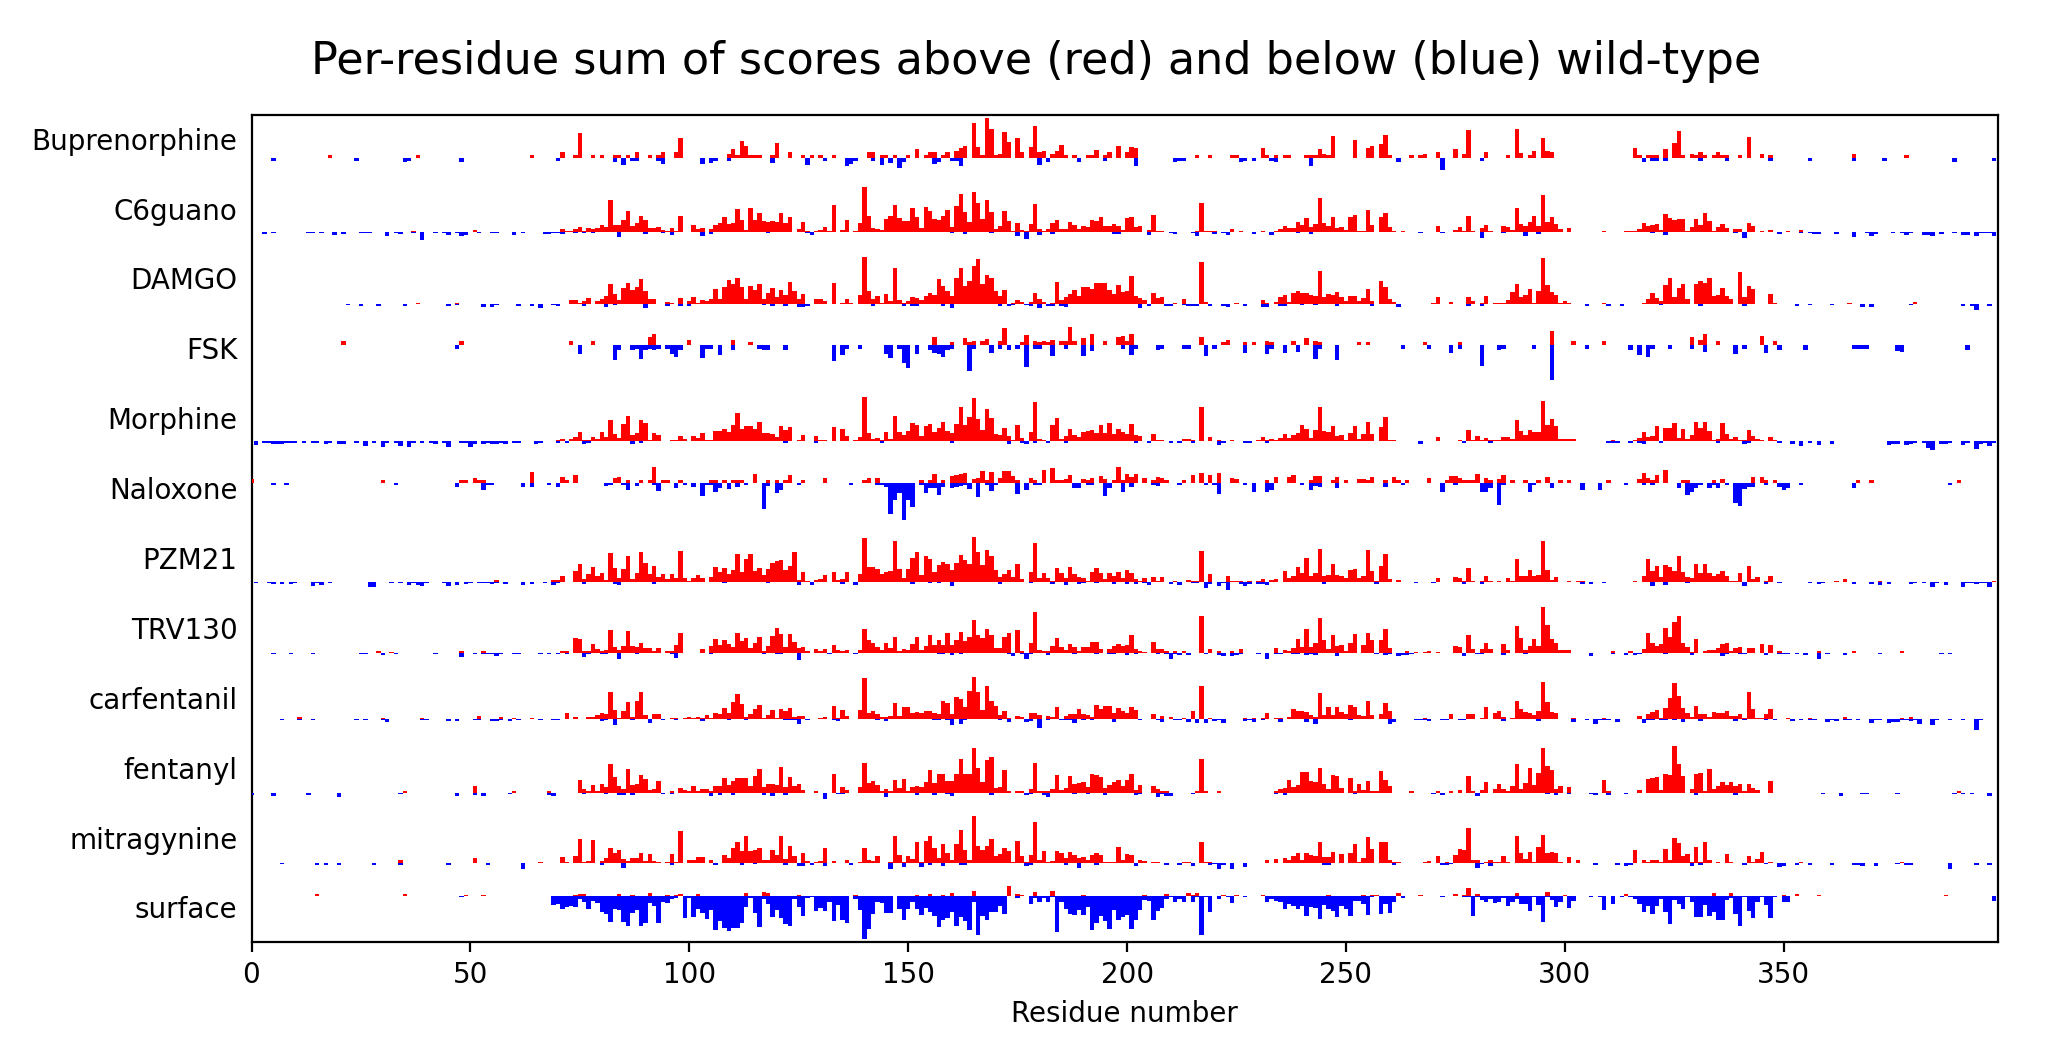
I was looking for a way to see an overview of the DMS scores when there are many different assays (12 for the opioid data). I tried plotting the per-residue scores, that is the sum of mutation scores at least 2 standard deviations above synonymous (red) and at least 2 standard deviations below synonymous (blue). I plot them as a bar graph for each assay with residue number along the horizontal axis. Attached is an image of this plot for the opiod data Willow and Matt Howard gave me that I made in ChimeraX with the attached script.
The idea is that this would be interactive, you could mouse over it or drag boxes on it and it would highlight or color the corresponding residues in an opioid receptor structure. I haven't implemented that interactive part.
Attachments (2)
Change History (6)
by , 9 months ago
| Attachment: | lilace_scores_wide_all.png added |
|---|
by , 9 months ago
| Attachment: | trace_plot.py added |
|---|
ChimeraX Python script that made the example trace plot. I'm not going to attach the DMS data since it is private.
comment:1 by , 9 months ago
From: "Howard, Matthew"
Subject: Re: Deep mutational scanning dataset
Date: October 10, 2025 at 4:02:57 PM PDT
To: Tom Goddard
Cc: "Coyote-Maestas, Willow"
Hi Tom,
I think this could be useful! Making this plot interactive similar to the scatter plot feature to enable highlighting/selecting on a structure would be nice. For selecting residues/positions on this plot, would they have to be in a continuous stretch, or could we select individual positions that are distant in sequence space? Additionally, would it be possible for the user to specify the score or cutoffs that are used in the plot? For instance, could we use a mean score, or filter for a certain surface expression score and then calculate a score?
...
Thanks for looking at this!
Matt
comment:2 by , 9 months ago
From: Tom Goddard
Subject: Re: Deep mutational scanning dataset
Date: October 10, 2025 at 4:18:01 PM PDT
To: "Howard, Matthew"
Cc: "Coyote-Maestas, Willow"
Hi Matt,
I think all your suggestions are possible. It's just a matter of how to make a user interface that presents those options. Selecting non-contiguous stretches, seems pretty easy. Most software uses "shift-click" to add to the selection and that could let you click or drag a set of non-contiguous regions. Specifying the cutoffs can be done, right now I hard coded +/- 2 standard deviations from mean of synonymous scores. Could also allow specifying a numeric cutoff, e.g. sum scores greater than 1.5. Not sure what you mean by "fillter for a certain surface expression score". Do you mean only consider mutations that have some minimum surface expression, or are within a specified surface expression range? Or do you mean normalize other scores by the surface expression score?
...
Tom
comment:3 by , 9 months ago
Begin forwarded message:
From: "Coyote-Maestas, Willow"
Subject: Re: Deep mutational scanning dataset
Date: October 10, 2025 at 6:32:56 PM PDT
To: Tom Goddard
Cc: "Howard, Matthew"
...
I think these bar plots are quite a nice idea - I think just learning how to make them maximally informative will be useful. We could also consider interactive heatmaps so it’s easier to directly compare behavior across related residues. Perhaps we can chat about it next week to have more active back and forth.
Be well,
Willow
comment:4 by , 9 months ago
| Cc: | added |
|---|
Example trace plot image.