Opened 11 months ago
#18401 assigned enhancement
Show Alphabridge interface circle plot for Boltz predictions
| Reported by: | Owned by: | Tom Goddard | |
|---|---|---|---|
| Priority: | moderate | Milestone: | |
| Component: | Structure Analysis | Version: | |
| Keywords: | Cc: | Eric Pettersen, Elaine Meng | |
| Blocked By: | Blocking: | ||
| Notify when closed: | Platform: | all | |
| Project: | ChimeraX |
Description
Arun Gupta asked on the ChimeraX mailing list about using Boltz predictions with the Alphabridge web site that makes circular residue-residue interaction plots colored by interfaces.
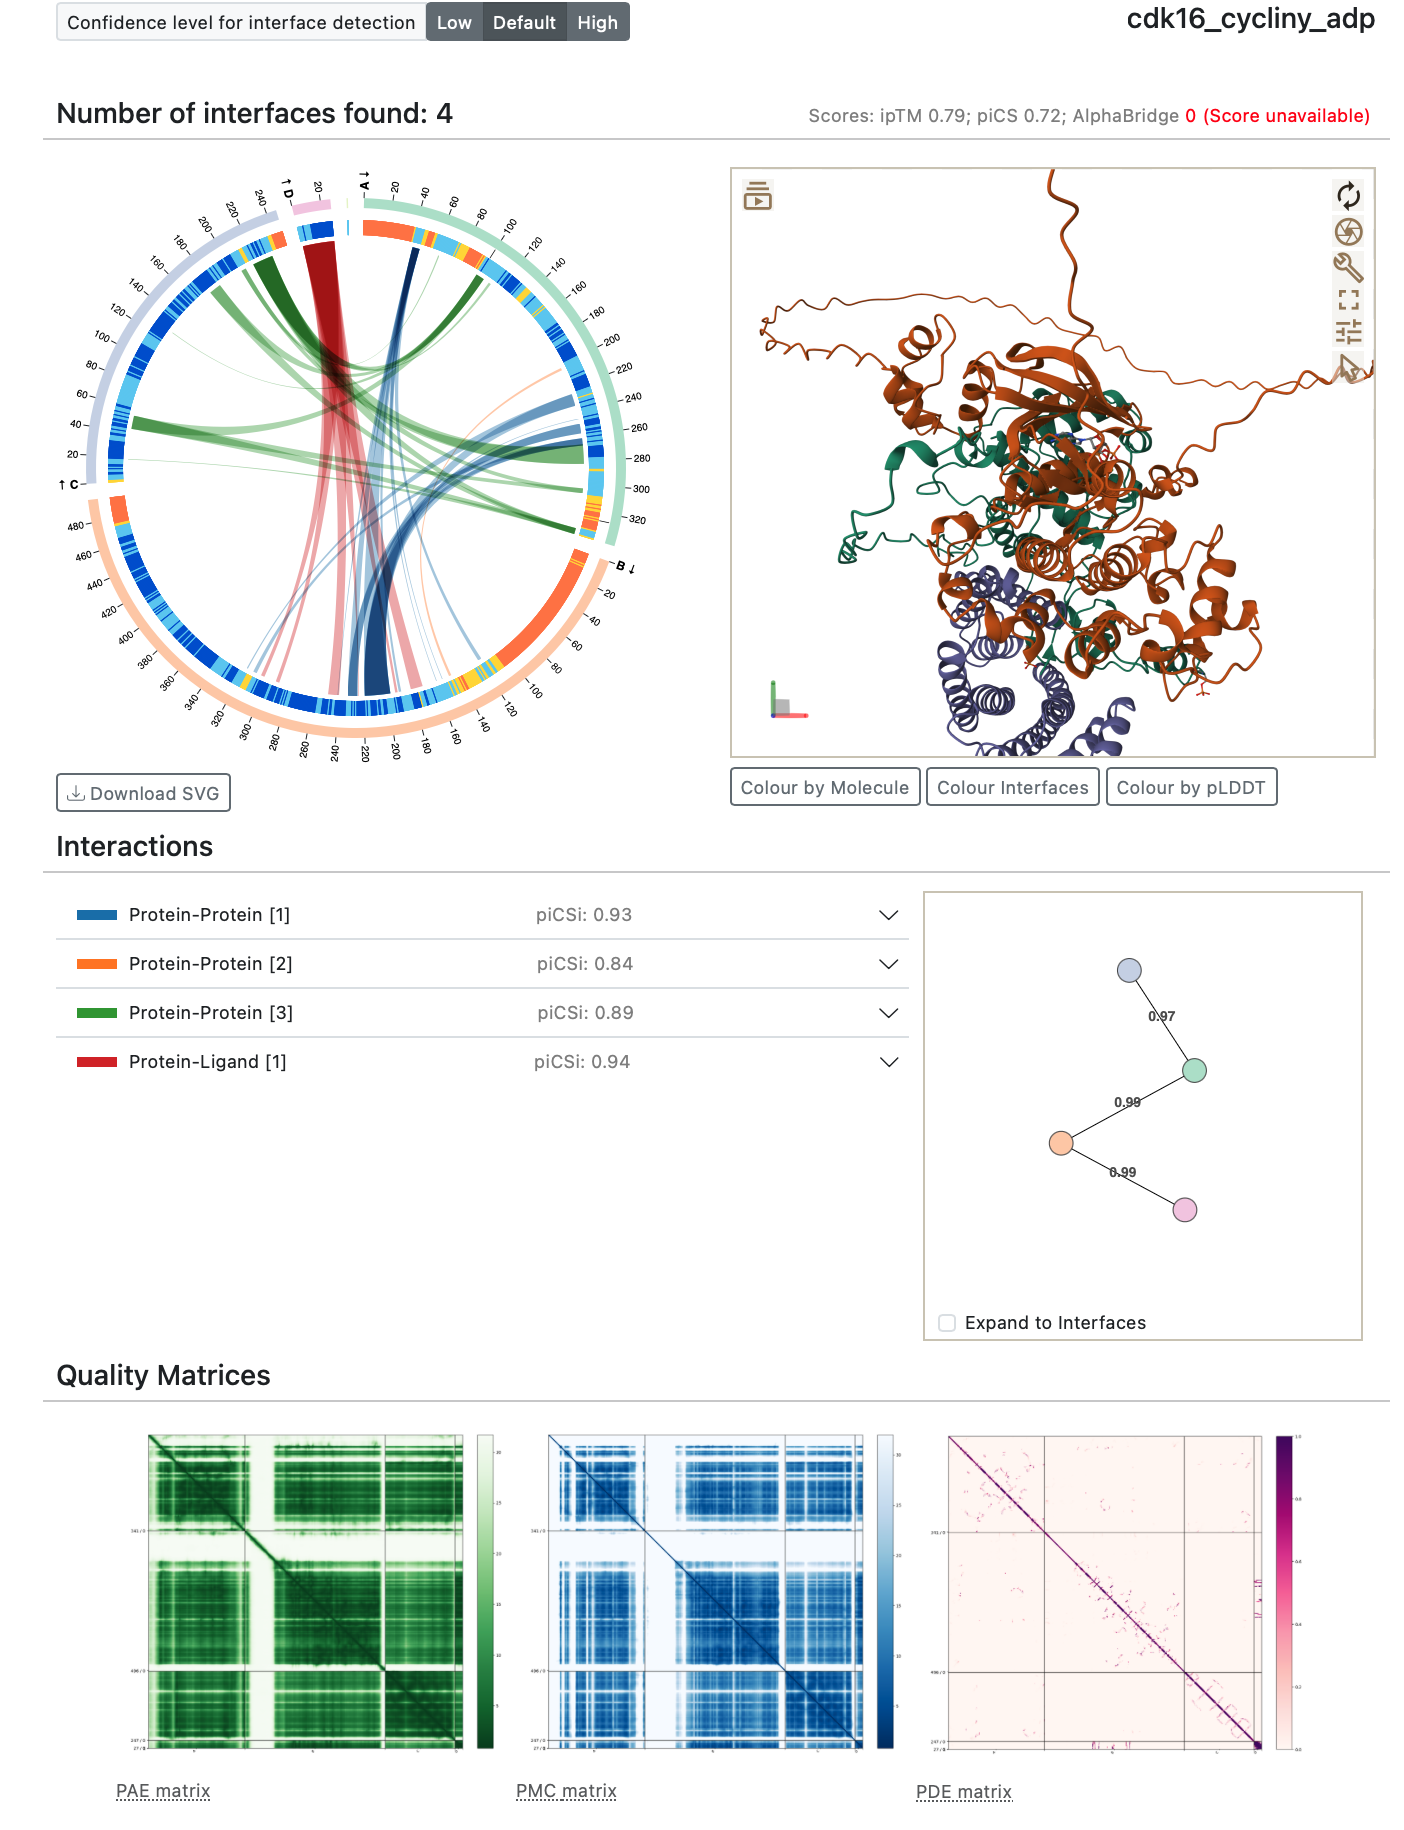
It would be nice if ChimeraX could display that kind of plot. It seems it would only need a structure and it doesn't need to be a predicted structure, any structure would do. The residues of all chains and ligands are laid out in a circle and lines connecting different residues are shown color differently for each interface. The Alphabridge plot gives scores for each interface. Those scores could be replaced by a variety of metrics such as buried surface area, number of hydrogen bonds, number of contacting residues, .... Might even provide a table of those interface statistics.
Example of Alphabridge web server output.