Opened 7 years ago
Closed 6 years ago
#1748 closed enhancement (fixed)
Extend solid rendering brightness curve
| Reported by: | Owned by: | Tom Goddard | |
|---|---|---|---|
| Priority: | normal | Milestone: | |
| Component: | Volume Data | Version: | |
| Keywords: | Cc: | ||
| Blocked By: | Blocking: | ||
| Notify when closed: | Platform: | all | |
| Project: | ChimeraX |
Description
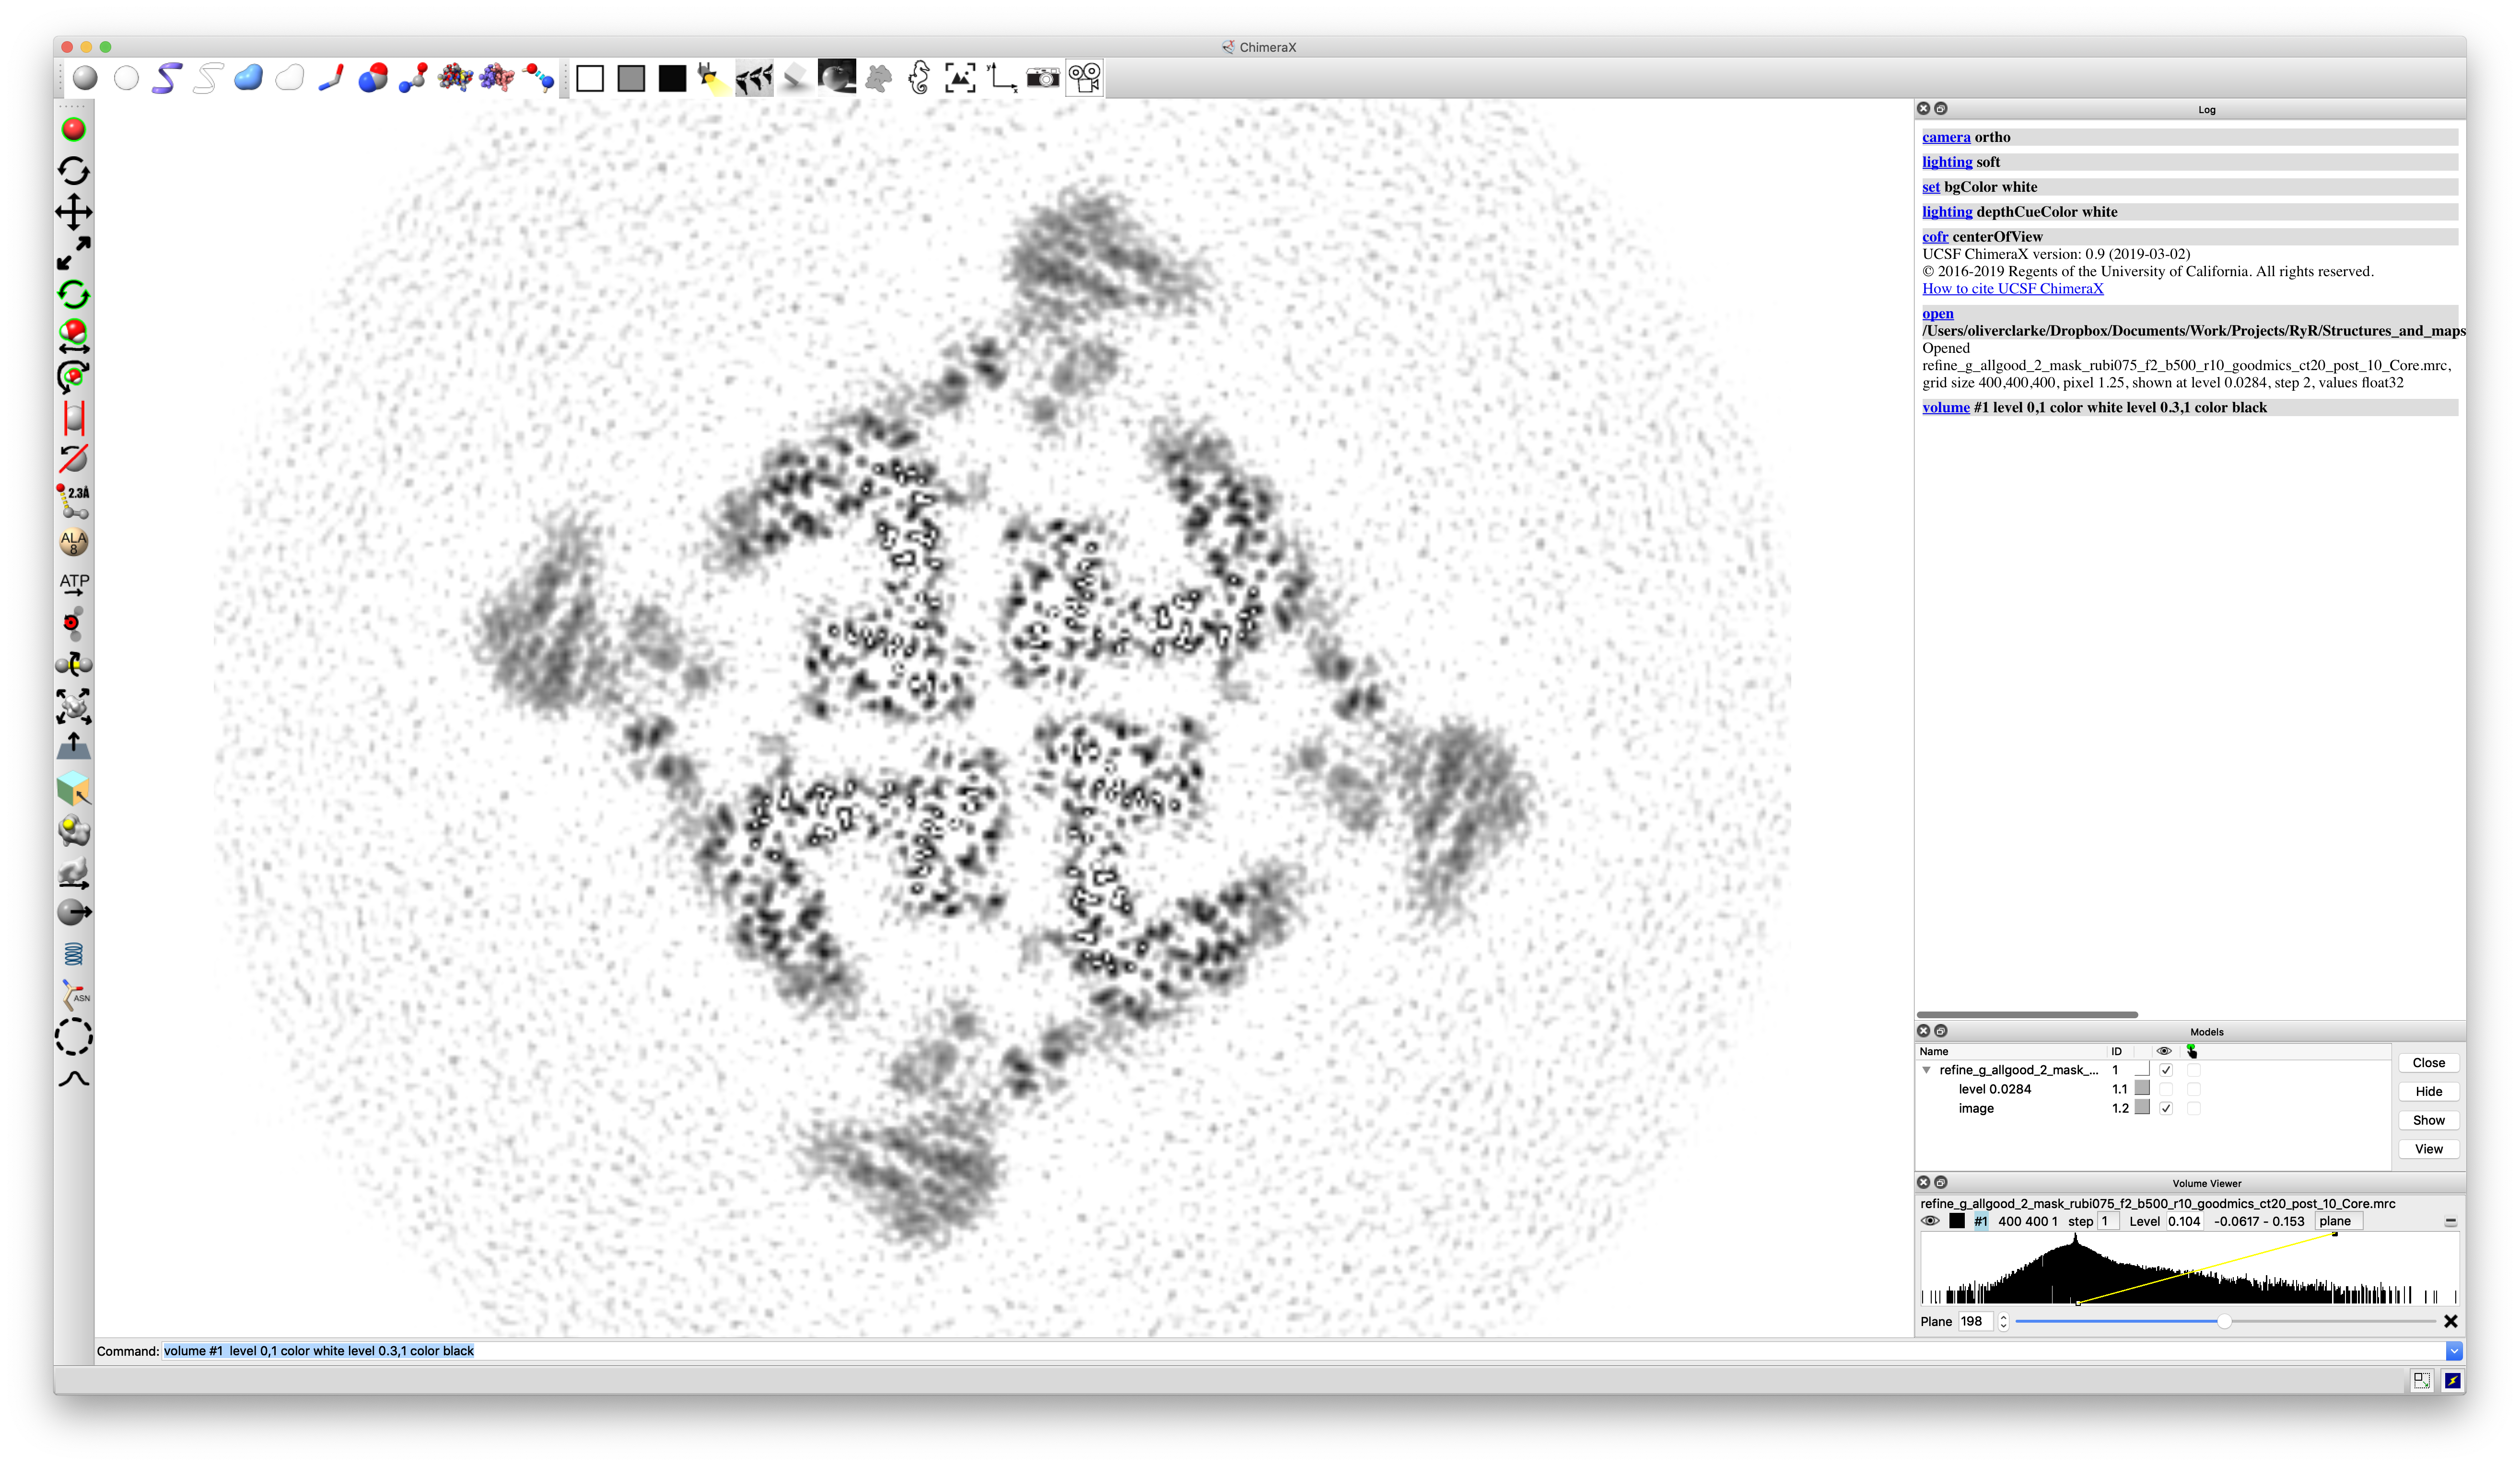
The following bug report has been submitted:
Platform:        Darwin-18.2.0-x86_64-i386-64bit
ChimeraX Version: 0.9 (2019-03-02)
Description
Hi,

This is less a bug and more a feature request, regarding coloring of planes (see attached scrrenshot).

If I have a plane with two thresholds, one lower, one upper, it seems like anything above the highest threshold is not colored (and therefore has the same color as the background), and similarly for anything below the lowest threshold. When displaying a single plane, I think it would be better if what are effectively akin to clipped highlights and shadows were colored the same as the nearest threshold - so in the attached screenshot, the strong bits of density in the middle of otherwise dark regions would be colored black.

Cheers,
Oli

Log:
> camera ortho

> lighting soft

> set bgColor white

> lighting depthCueColor white

> cofr centerOfView

UCSF ChimeraX version: 0.9 (2019-03-02)
© 2016-2019 Regents of the University of California. All rights reserved.
How to cite UCSF ChimeraX

> open
/Users/oliverclarke/Dropbox/Documents/Work/Projects/RyR/Structures_and_maps/ryr_maps_paper2/paper2_maps/ca30/refine_g_allgood_2_mask_rubi075_f2_b500_r10_goodmics_ct20_post_10_Core.mrc

Opened
refine_g_allgood_2_mask_rubi075_f2_b500_r10_goodmics_ct20_post_10_Core.mrc,
grid size 400,400,400, pixel 1.25, shown at level 0.0284, step 2, values
float32

> volume #1 level 0,1 color white level 0.3,1 color black

> set bgColor black

> set bgColor white


OpenGL version: 4.1 ATI-2.4.10
OpenGL renderer: AMD Radeon Pro 580 OpenGL Engine
OpenGL vendor: ATI Technologies Inc.
File attachment: Screen Shot 2019-03-05 at 11.36.49 AM.png
Attachments (1)
Change History (4)
by , 7 years ago
| Attachment: | Screen Shot 2019-03-05 at 11.36.49 AM.png added |
|---|
comment:1 by , 7 years ago
| Component: | Unassigned → Volume Data |
|---|---|
| Owner: | set to |
| Platform: | → all |
| Project: | → ChimeraX |
| Status: | new → assigned |
| Summary: | ChimeraX bug report submission → Different above/below threshold coloring |
| Type: | defect → enhancement |
comment:2 by , 7 years ago
| Summary: | Different above/below threshold coloring → Extend solid rendering brightness curve |
|---|
The usual method of achieving what you want is to add a third node to the brightness curve on the histogram and put it in the upper right corner of the histogram. You add a node using right click, or ctrl-click on the histogram. ChimeraX initially makes 3 node brightness curves with the first segment a linear ramp, and second second flat to achieve this.
I think making the brightness curve automatically extend to the right and left beyond the ends of the curve might be a better behavior. The situation that commonly arises is that the initial ChimeraX map display shows one plane and creates an initial brightness curve based on the range of data values in that plane. Then when showing a different plane or the entire volume the maximum data value increases and the curve does not extend to that maximum value. If the curve was automatically extended this would improve appearance. If this change was made the histogram should definitely show the extension. Extending to lower data values than the lowest curve point would have a somewhat bad effect because if the user raise that node even a tiny amount then all lower data values which is often noise will suddenly become visible. There is the issue of whether both modes (extend / don't extend) should be supported with an option. If there is no option and the curve is always extended horizontally one could still get the old behavior by adding a node so the curve drops to zero at its ends.
comment:3 by , 6 years ago
| Resolution: | → fixed |
|---|---|
| Status: | assigned → closed |
The brightness curve was made to automatically extend to the right about 6 months ago. It does not automatically extend to the left. It may be better if if automatically extended to the left, especially for EM tomograms where the objects of interest (proteins, nucleic acids) have lower intensity values. But in other cases extending to the left is mostly annoying since if the leftmost point is not at 0 then extending left gives brightness to all the noise.
There are volume command options colormapExtendRight and colormapExtendLeft that control this.
Added by email2trac