Google™ Search
December 25, 2025
The RBVI wishes you a safe and happy holiday season!
See our
2025 card and the
gallery of previous cards back to 1985.
September 22, 2025
Mac users may wish to defer upgrading to MacOS Tahoe.
Currently on that OS the Chimera graphics window is shifted so that it covers
the command and status lines.
March 6, 2025
Chimera production release 1.19 is now available,
fixing the ability to fetch structures from the PDB
(1.19 release notes).
Previous news...
Please note that
UCSF Chimera is legacy software that is no longer being developed or supported.
Users are strongly encouraged to try
UCSF ChimeraX, which is under active development.

UCSF Chimera is a program for the interactive visualization
and analysis of molecular structures and related data,
including density maps, trajectories, and sequence alignments.
It is available free of charge for noncommercial use.
Commercial users, please see
Chimera commercial licensing.
We encourage Chimera users to try ChimeraX
for much better performance with large structures, as well as other major
advantages
and completely new features in addition to nearly all the capabilities
of Chimera (details...).
Chimera is no longer under active development.
Chimera development was supported by a grant from the
National Institutes of Health (P41-GM103311)
that ended in 2018.

- determination of atom types
in arbitrary molecules, including non-standard residues
- ability to add hydrogen atoms
- high-quality hydrogen bond identification
- selection of atoms/bonds by element, atom type,
functional group, amino acid category
- interactive bond rotation, distance and angle measurements
(More features...)
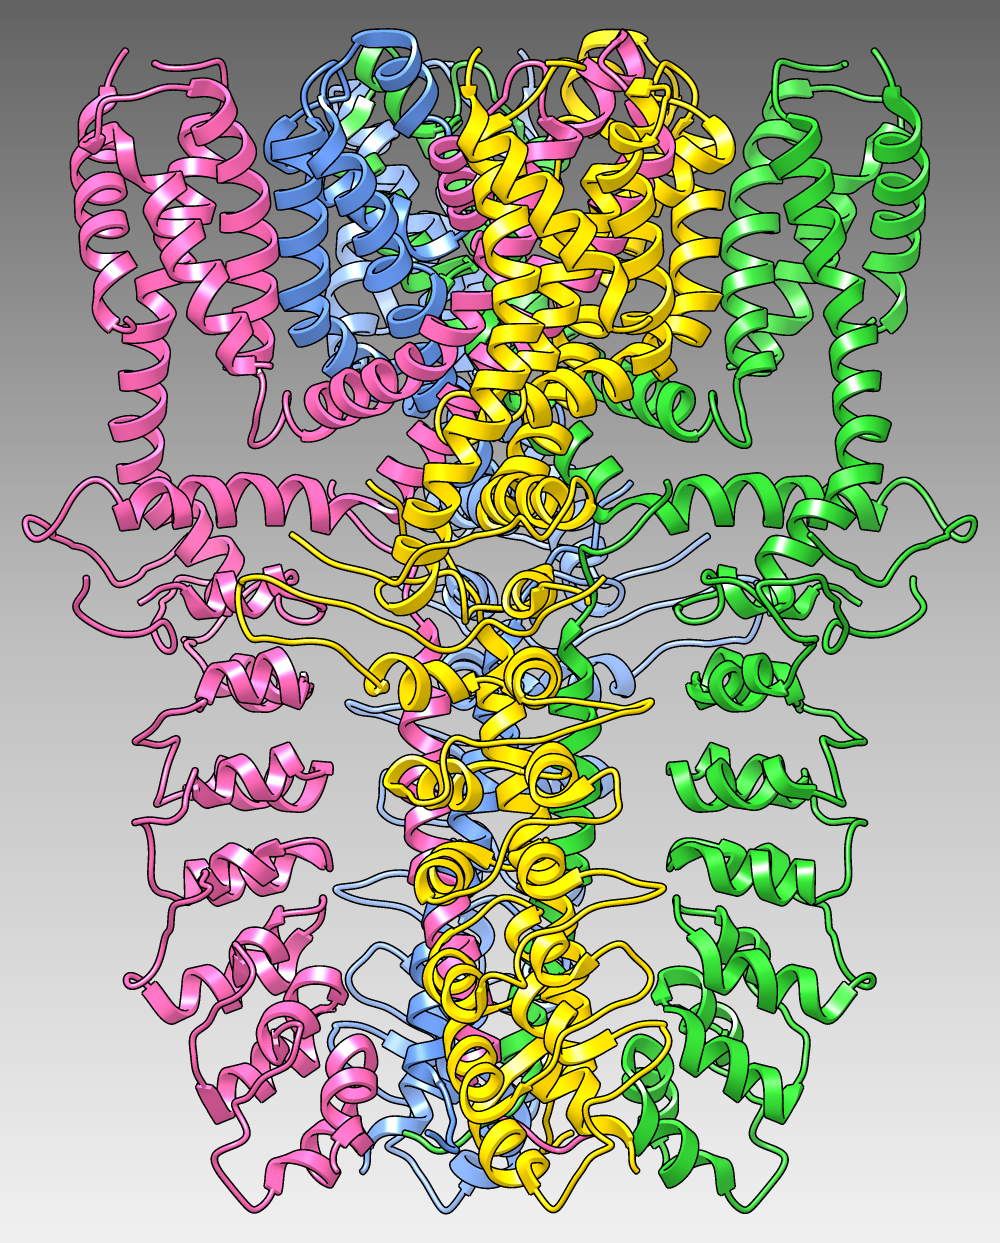
The image shows
the structure of the human TRPA1 ion channel (wasabi receptor)
determined by electron cryo-microscopy, Protein Data Bank entry
3j9p.
The four subunits of the tetramer are shown as
ribbons in different colors over a dark-to-light gradient background.
(More samples...)
About RBVI
| Projects
| People
| Publications
| Resources
| Visit Us
Copyright 2018 Regents of the University of California.
All rights reserved.
