

 about
projects
people
publications
resources
resources
visit us
visit us
search
search
about
projects
people
publications
resources
resources
visit us
visit us
search
search
Quick Links
Featured Citations
Bitter taste receptor activation by cholesterol and an intracellular tastant. Kim Y, Gumpper RH et al. Nature. 2024 Apr 18;628(8008):664–671.
Structure and assembly of a bacterial gasdermin pore. Johnson AG, Mayer ML et al. Nature. 2024 Apr 18;628(8008):657–663.
Structural basis of DNA crossover capture by Escherichia coli DNA gyrase. Vayssières M, Marechal N et al. Science. 2024 Apr 12;384(6692):227-232.
Molecular mechanism of actin filament elongation by formins. Oosterheert W, Boiero Sanders M et al. Science. 2024 Apr 12;384(6692):eadn9560.
Targeting DCAF5 suppresses SMARCB1-mutant cancer by stabilizing SWI/SNF. Radko-Juettner S, Yue H et al. Nature. 2024 Apr 11;628(8007):442–449.
More citations...News
January 22, 2024
ChimeraX 1.7.1 is available, with fixes for a few miscellaneous bugs that were identified after the 1.7 release.
December 19, 2023
The ChimeraX 1.7 production release is available! See the change log for what's new. Future Mac releases will require macOS 11 or higher.
November 6, 2023
The ChimeraX 1.7 release candidate is available – please try it and report any issues. See the change log for what's new.
Previous news...Upcoming Events
UCSF ChimeraX (or simply ChimeraX) is the next-generation molecular visualization program from the Resource for Biocomputing, Visualization, and Informatics (RBVI), following UCSF Chimera. ChimeraX can be downloaded free of charge for academic, government, nonprofit, and personal use. Commercial users, please see ChimeraX commercial licensing.
ChimeraX is developed with support from National Institutes of Health R01-GM129325, Chan Zuckerberg Initiative grant EOSS4-0000000439, and the Office of Cyber Infrastructure and Computational Biology, National Institute of Allergy and Infectious Diseases.
Feature Highlight

3D images and time series from multichannel optical microscopy are shown in the Volume Viewer tool, with easy access to hiding/showing individual channels, changing their colors, and adjusting threshold levels with the mouse. The menu of style options includes “volume” (translucent blobs, as in the image), surface, mesh, maximum intensity projection, single plane, and orthoplanes. For convenience, the step size, region bounds, and display style of different channels of the same dataset are coupled, in that changing the setting of one channel automatically changes it for the others.
The image shows human induced pluripotent stem cells, with plasma membrane in violet red, EGFP-tagged fibrillarin (as a marker for nucleolus) in yellow, and DNA (nucleus) in turquoise. The data are publicly available from the Allen Cell Explorer website, dataset: AICS-14_0.
More features...Example Image
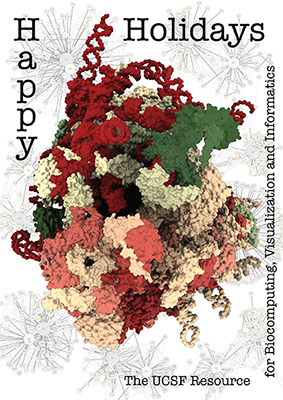
The architecture of the human ribosome has been determined at near-atomic resolution by electron microscopy (Anger et al., Nature 497:80 (2013)). The structure, comprising 82 proteins and five RNA molecules, is shown with shadows cast from all directions to accentuate depth. In the background are schematic representations of contacts between the component molecules.
See the image setup script card.cxc using the 'Tis the Season color palette (credit to MrsP). See also the RBVI holiday card gallery.
About RBVI | Projects | People | Publications | Resources | Visit Us
Copyright 2018 Regents of the University of California. All rights reserved.