
 |
| q = (4πsinθ) / λ |
| 2θ is the scattering angle, λ the incident wavelength |
Small-Angle X-Ray Profile calculates a theoretical small-angle X-ray scattering (SAXS) profile from a set of atoms. The result can be displayed along with an experimental profile provided by the user. Calculations are performed with the program FoXS,
FoXS: a web server for rapid computation and fitting of SAXS profiles. Schneidman-Duhovny D, Hammel M, Sali A. Nucleic Acids Res. 2010 Jul 1;38 Suppl:W540-4.either locally or via a web service hosted by the UCSF RBVI. See also: fetching PDB-biounit and PQS files, sym
There are several ways to start Small-Angle X-Ray Profile, a tool in the Higher-Order Structure category.
The Molecule setting controls which atoms will be included in the calculation:
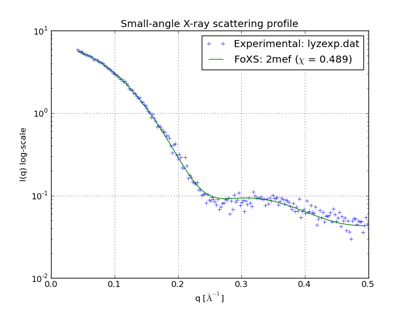
Optionally, an Experimental profile can be read from a file. If an experimental profile is provided, the theoretical profile will be scaled to fit the data. The file should contain an initial comment line followed by three whitespace-preceded columns: q value, measured scattering, and measured scattering error (see an example file for lysozyme). The error values are used for fitting but are not plotted.
For comparison to experimental data, the structure should be as similar as possible to the experimental sample in terms of which atoms are present (not missing domains, loops, or parts of residues). Dock Prep can be used to repair truncated side chains and/or add explicit hydrogens.
Clicking Options reveals additional settings
(clicking the close button  on the right
hides them again):
on the right
hides them again):
Clicking Calculate Profile computes the theoretical profile and displays it as a solid line. Data points in the experimental profile (if any) are shown as plus signs, and a measure of the quality of fit between the experimental and theoretical profiles, χ, is given in the legend. A lower value of χ indicates a better fit.
Close dismisses the Small-Angle X-Ray Profile dialog. Help opens this manual page in a browser window.
Plots are generated with matplotlib. Icons for manipulating and saving the view are provided below the graph. The mode icons act as toggles: clicking the icon will turn the mode on or off, depending on the current state.
| icon | meaning |
|---|---|
 |
default (initial) view |
 |
previous view |
 |
next view |
 |
“pan/zoom” mode (toggle) |
 |
“zoom to rectangle” mode (toggle) |
 |
sliders for graph scaling |
 |
save as image file (it may be necessary to include the proper filename suffix to indicate format: *.png [Portable Network Graphics], *.ps [PostScript], *.eps [Encapsulated PostScript], *.pdf [Portable Document Format], *.svg [Scalable Vector Graphics]) |