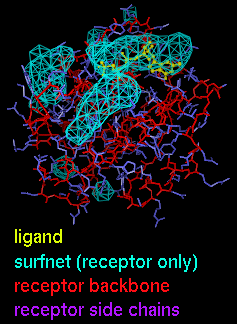
Surfnet 
Surfnet finds and displays molecular cavities and indentations.
The method is an adaptation of that described in:
R.A. Laskowski,
"SURFNET: A program for visualizing molecular surfaces, cavities, and
intermolecular interactions" J Mol Graph 13:323 (1995).
 There are several ways to start
Surfnet, a tool in the Docking category.
Surfnet comes in two flavors called
SurfNet - option, where option
can be Interface (find cavities between molecules) or
Selected Atoms (find cavities and surface indentations adjacent
to the specified atoms).
If Surfnet - Selected Atoms is chosen, it is necessary to enter an
atom specification.
If Surfnet - Interface is chosen,
atom specifications
for the receptor and ligand(s) are required. The receptor and ligand(s)
may be in the same model or different models.
A brief description of the method is needed to explain the remaining options:
- Pairwise combinations of atoms are examined for intervening
void space. If the type of calculation is Interface,
only receptor atom/ligand atom pairs are examined; if there are multiple
ligands, they are treated collectively. If the type of calculation is
Selected Atoms, only pairs of atoms included in the input
atom specification
are examined.
In all cases, only pairs of atoms no farther apart than the
Distance Cutoff (in angstroms) are examined. A "gap
sphere" is placed directly between the two atoms and shrunk until it no
longer intersects the VDW surface of any atom.
Atomic radii are
assigned by Chimera based on inferred atom types.
Gap spheres with radii equal to or greater than the Grid Interval
(also see below) are retained.
- The Density of each gap sphere is smeared out from its center
according to a Gaussian or Quadratic function such that the
value at its radius (100.0 in arbitrary units) is half the value at its
peak (200.0).
- At each point in a 3-dimensional grid, only the largest density
contribution from a gap sphere is stored (not necessarily the contribution
from the nearest gap sphere center, since the decrease in density with
distance depends on radius). The resolution of the grid in angstroms
(Grid Interval) is under user control.
- The grid values are used to generate a contour surface at the level
of 100.0. The Compact option collapses small triangles in the
contour surface into single points.
- The contour surfaces are displayed as a Mesh or solid
Surface Representation opened as a VRML object
into the lowest available model number.
To assign a Color other than the default cyan to the contour surface,
click the color well
in the dialog before clicking OK or Apply.
This will bring up the
Color Editor, in which a new color can be created.
OK executes a Surfnet calculation
and dismisses the dialog. Apply runs the calculation
without closing the dialog; each successive click on Apply
will create and display another contour surface according to the current
settings. Close closes the dialog, and Help opens this
manual page in a browser window.
UCSF Computer Graphics Laboratory / March 2003


 There are several ways to start
Surfnet, a tool in the Docking category.