Tom Goddard
May 26, 2017
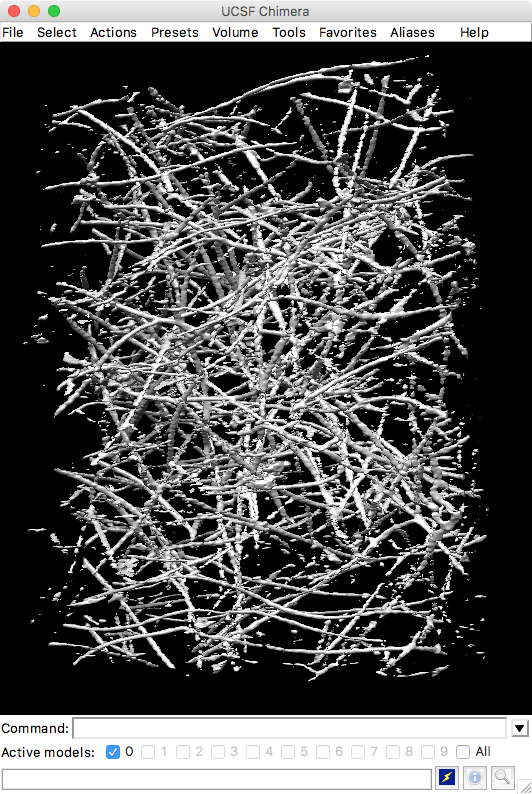
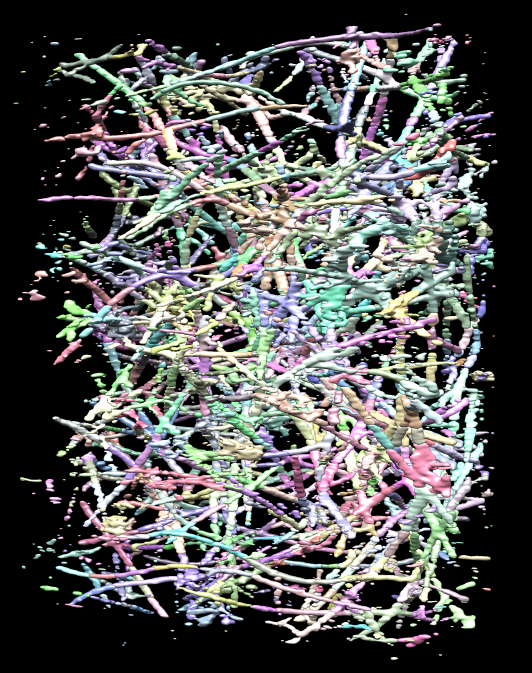
How to place markers and trace filaments in volume time series in Chimera 1.11.2. Will show this with 3d light microscopy of a network of collagen filaments.
A movie example of the capabilities shown here shows traced Drosophila chromosomes during mitosis, data from John Sedat. This is from the Chimera animation gallery.
Here are links to documentation for the main Chimera tools described on this page: Volume Tracer, Volume Series, Volume Viewer.
Open volume series from a Chimera map (*.cmap) HDF5 file for fastest access to large data sets.
open /Users/goddard/cell44_ch0_decon_rescale.cmap
|
|
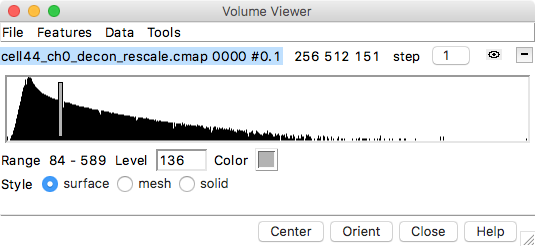
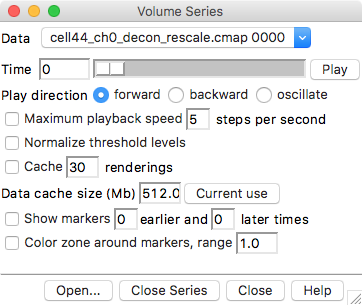
This data set is 15 Gbytes. To allow playing through faster change step to 2 in the Volume Viewer window, set Data Cache Size to 10000 Mbytes in the Volume Series window (if computer has 16 Gbytes of memory) and press the Enter key, press the Play button and wait 30 seconds for it to play through all the data (limited mostly by disk bandwidth), after which it will play through much faster, then press Stop.
We will mostly discuss placing markers, but before getting into that let's see what the Segger segmentation method does on this filament data. Use Volume Viewer window menu Tools / Segment Map. Set a reasonable threshold using the vertical bar on the Volume Viewer histogram since the segmentation tool will only consider density above that threshold level. In the Segment Map dialog choose the map to be the time you are currently viewing (shown in Volume Viewer window), and press the Segment button.
This segmentation method uses watershed segmentation combined with map smoothing to divide the map into connected pieces. It is not intended to work on filaments. Pressing the Group button in the Segment Map dialog can combine colored regions into larger regions. Some modification of this segmentation algorithm to work on filaments might give a more interesting result.
Close the segmentation with Segment Map window menu File / Close all segmentations.
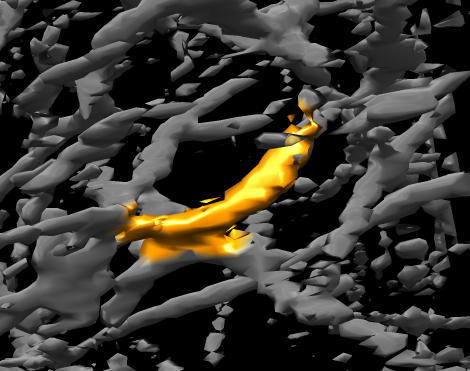
Find an interesting collagen filament to trace, one that moves, using the slider in the Volume Series window to look through the time series.
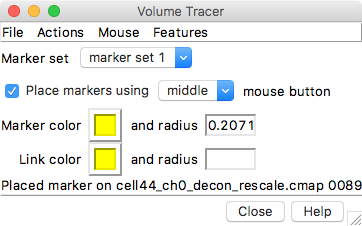
Use Volume Viewer menu entry Tools / Volume Tracer to show the Volume Tracer window. Click with the middle mouse button (using a 3-button mouse) on the collagen filament to place a marker. On a Mac with a trackpad hold the Option key and click to emulate the middle mouse click. The marker might be placed entirely inside the surface making it invisible. Click the mesh option in the volume viewer window to see through the surface. Another approach is to make the surface transparent, press the Color button in the volume viewer window, click the Opacity switch in the Color Editor that appears and adjust the A slider which controls opacity.
To delete a marker, select it by ctrl-click (left mouse button) on it and use Volume Tracer menu entry Actions / Delete markers. If the marker is behind a transparent surface ctrl-click will select the surface. To enable selecting through the surface do the following.
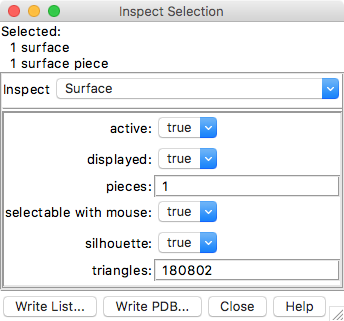
Ctrl-click on a transparent surface will select the surface instead of the marker behind the surface. To select the marker, make the surface unselectable. To do this first select the surface (ctrl-click) then press the magnifying glass icon in the lower right corner of the main window to show the Selection Inspector, switch to Inspect Surface, and change the selectable with mouse setting to false. Now you can ctrl-click to select a marker behind the transparent surface.
Unfortunately the green outline around selected objects does not show up behind a transparent surface. So you may need to switch to mesh style (in volume viewer window) to see the green outline. This problem will be remedied in ChimeraX.
These steps have only enabled selecting through one map in the time series. So if we view a different time it won't select markers through the map. To remedy this select all the maps using command select #0 typed to the Command-line (menu Favorites / Command Line). The selection inspector dialog now says 112 surfaces and selectable with mouse can be set to False for all of them.
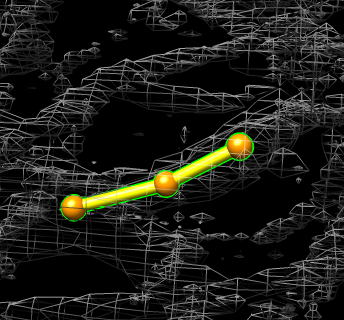
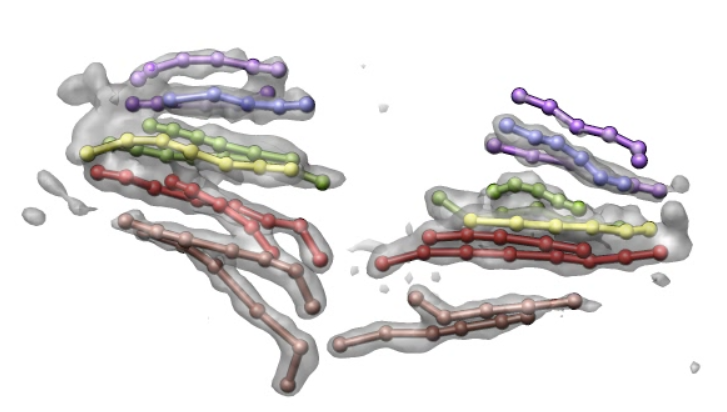
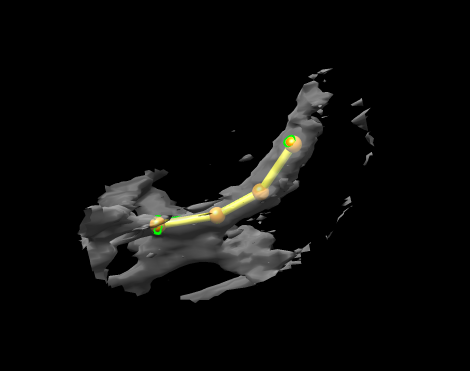
To connect the placed markers use menu Mouse / Link consecutively selected markers in the Volume Tracer window, the select each marker in turn (ctrl-click) and cylinders will be drawn joining the markers.
To select all connected markers, select one with ctrl-click then press the up-arrow key twice. The first up-arrow adds the adjoining marker and the next adds all connected markers.
To change the color of the markers use the color button in the Volume Tracer dialog. To color the links to match the markers you can drag from the marker color button to the link color button in the volume tracer dialog. Change the radius of selected markers or links by entering a new numeric value in the entry field in the Volume Tracer dialog and press the Enter key.
Markers can be placed on the maps for different time points and the markers remember which time they are associated with. Only the markers for the currently displayed map time can be shown. To achieve this enable the Show markers 0 earlier and 0 later times checkbutton in the volume series window.
Unfortunately there seems to be a bug here where markers that were placed before enabling the Show markers... option don't have a map time associated with them. So delete the markers already placed and place new ones.
Click to the next time clicking to the right of the slider handle in the Volume Series window to advance one time point and place additional markers on the same moved filament. Note that there is a delay of a second or two placing the first marker on a time point because it loads the full resolution data to determine how far beneath the pointer to place the marker. It is not already loaded since we are looking at the step 2 data which takes every other data point along each axis.
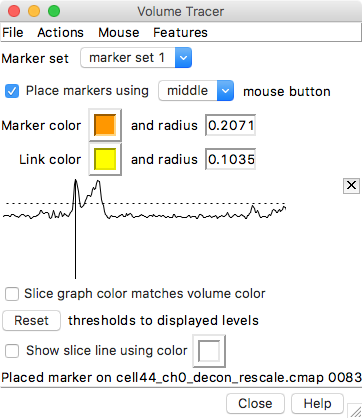
When you click to place a marker it places the marker on the first local maximum of the density above the displayed surface level along the line of sight through the mouse pointer. You can show the density profile along this line using Volume Tracer menu entry Features / Slice Display. After placing a marker it shows the density profile. Dragging the vertical line on that plot moves the placed marker along the line of sight used when placing it.
To show markers for all times you should be able to unclick the Show markers 0 earlier and 0 later times... setting in the volume series window. But this does not seem to work -- another bug. So instead set the earlier and later times to a large value like 100 and press Enter.
This may reveal that you have accidentally connected markers from one time point to the next time point. This happens because of the link consecutively selected markers setting discussed above. To delete unwanted links, ctrl-click on them to select them and use Volume Tracer menu Actions / Delete links. Using shift-ctrl-click you can select multiple links and delete them all at once. Holding shift with ctrl-click adds to the current selected items instead of replacing them.
To color the map near the placed markers enable the Color zone around markers, range 1.0 option in the volume series window.
As you change times the new maps will also show this color zone. Unfortunately after returning to previous times the surface coloring has disappeared -- another bug. Apparently this bug happens because the surface is deleted when you switch to a new time. If you enable the Cache 30 renderings option in the volume series window then the coloring is preserved when times are switched.
To move an existing marker use volume tracer menu entry Mouse / Move and Resize Markers, then click (middle mouse button, as if placing a marker) on an existing marker and move it in xy directions. Holding the shift-key allows you to move it perpendicular to the screen (hard to see except when it passes through a surface), and having caps-lock depressed with change the radius of the marker as you drag the mouse.
To show only part of the map near some of the placed markers, select those markers (e.g. ctrl-click then press up-arrow to select a trace filament), then use Volume Viewer menu Features / Zone, click the Zone button that appears in the volume viewer window and adjust the radius slider to control how far from the markers the map is shown. Click No Zone to return to viewing the full map. Changing times in the volume series dialog will use the same zone using the originally selected markers. The Mask button will make a new map including just the zone, sometimes useful for further analysis.
Another kind of zone that limits the map display to a box containing the selected atoms plus some padding distance can be used with volume viewer dialog menu Features / Atom box. (Markers are fake atoms.)
| 
|
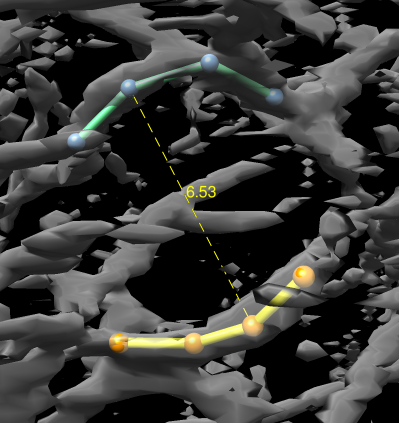
To measure a distance between two markers select the first marker with ctrl-click, and add the second marker with shift-ctrl-click, then type command "distance selected" in the command-line at the bottom of the main window which is shown with menu Favorites / Command Line. The distance will be shown with a dotted line labeled with a distance value. To get a list of the distances, delete distances, change the dotted line thickness and color, use the Distances dialog obtained from menu entry Tools / Structure Analysis / Distances.
To measure the length of a traced filament there is a keyboard shortcut "pl" that can be run as a command ac pl and reports the total length of the selected links in the status line and in the Reply Log (menu Favorites / Reply Log)
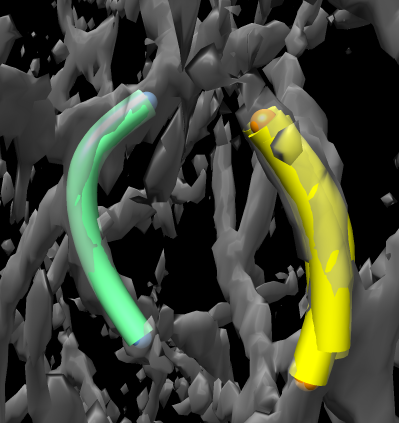
Smooth tubes can be shown for traced paths using Volume Tracer menu Features / Smooth Paths. It makes tubes for all paths in the current marker set with the specified radius. This will include paths for all time points. To have better control over which paths are used to make tubes use the shape tube command on selected markers.
Markers can be saved in an XML text file with volume tracer menu File / Save Markers. Such XML files can also be created using scripts and read into Chimera which can be used for get markers placed by algorithms into Chimera.