Tom Goddard
September 7, 2006
Interactive 3D visualization. Desktop computers (Windows, Mac, Linux, SGI). Free, development funded by NIH. A few thousand users.
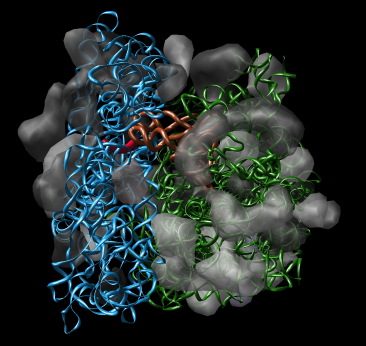
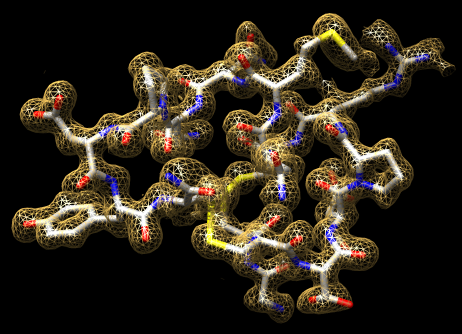
Chimera is primarily for analysis of molecular models.
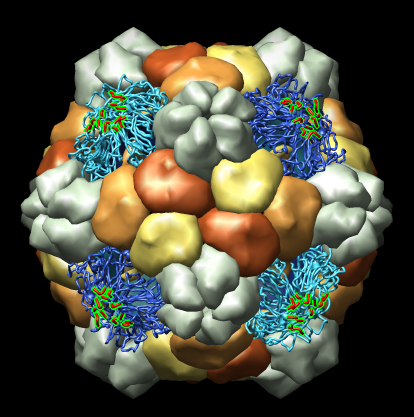
Many Chimera capabilities are for specialized molecular applications: protein and nucleic acid chemical structures, sequence alignment, icosahedral symmetry for virus particles, docking drugs in active sites.
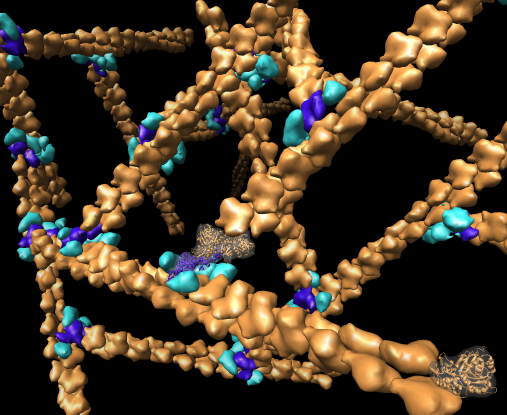
Chimera also has methods to analyze density maps: crystallograpic maps, single particle electron microscopy, electron microscope tomography, atomic force microscopy, three dimensional optical microscopy.
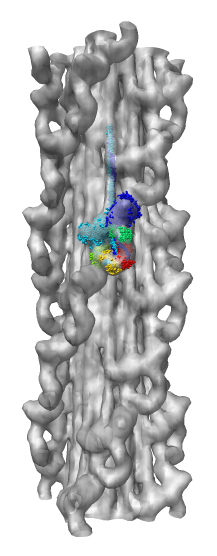
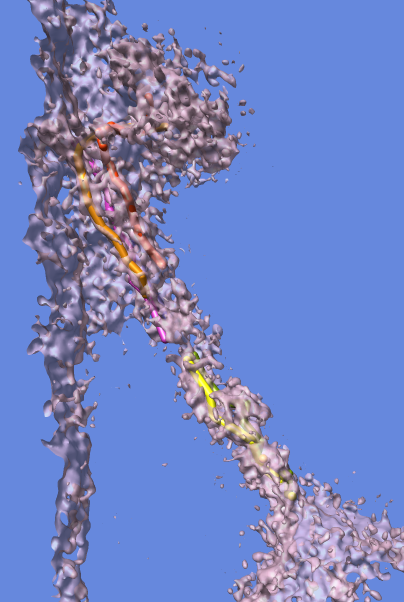
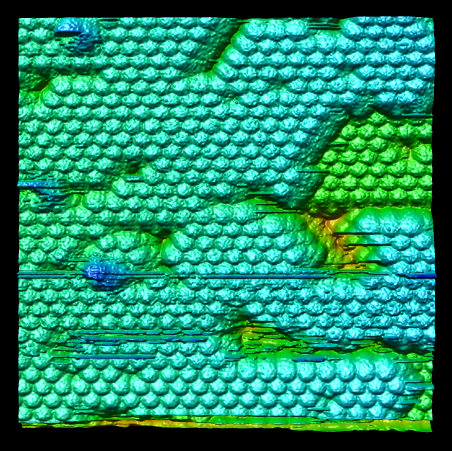
Collection of generic capabilities for maps. Segmenting, measuring volumes, lengths, angles, coloring and comparing substructures, building ball and stick models. Useful at any length scales, not just molecular scale. Submarine tracking.
Many map tools involving placing markers and linking markers to trace structures. The markers and links are a natural extension of molecular models in Chimera.
Tools are all interactive, computations that take at most seconds. They are useful when software for automated analysis that takes account of all the desired constraints is not available. The drawbacks are that interactive analysis is subjective and time-consuming.
There are no interesting algorithms behind these tools. They are a far from complete 3D drawing, painting, editing program.
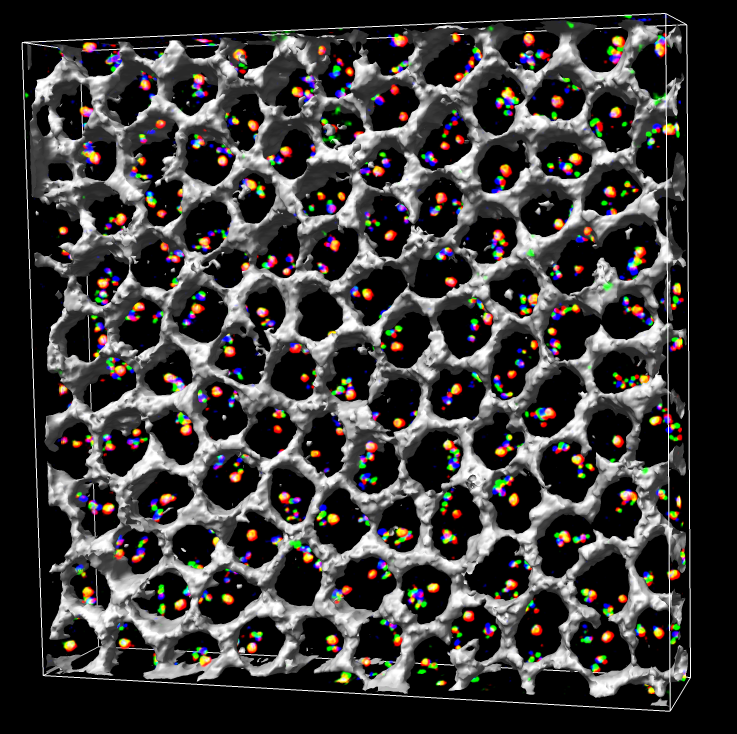
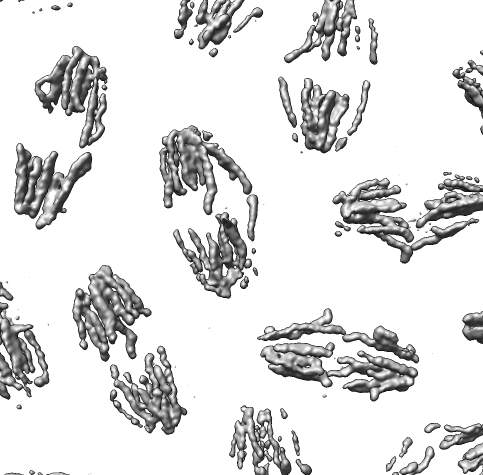
Figure 1. Approximately 100 Drosophila cells with color barcode labeling on chromosome 2L. Gray honeycomb indicates regions outside cell nuclei.
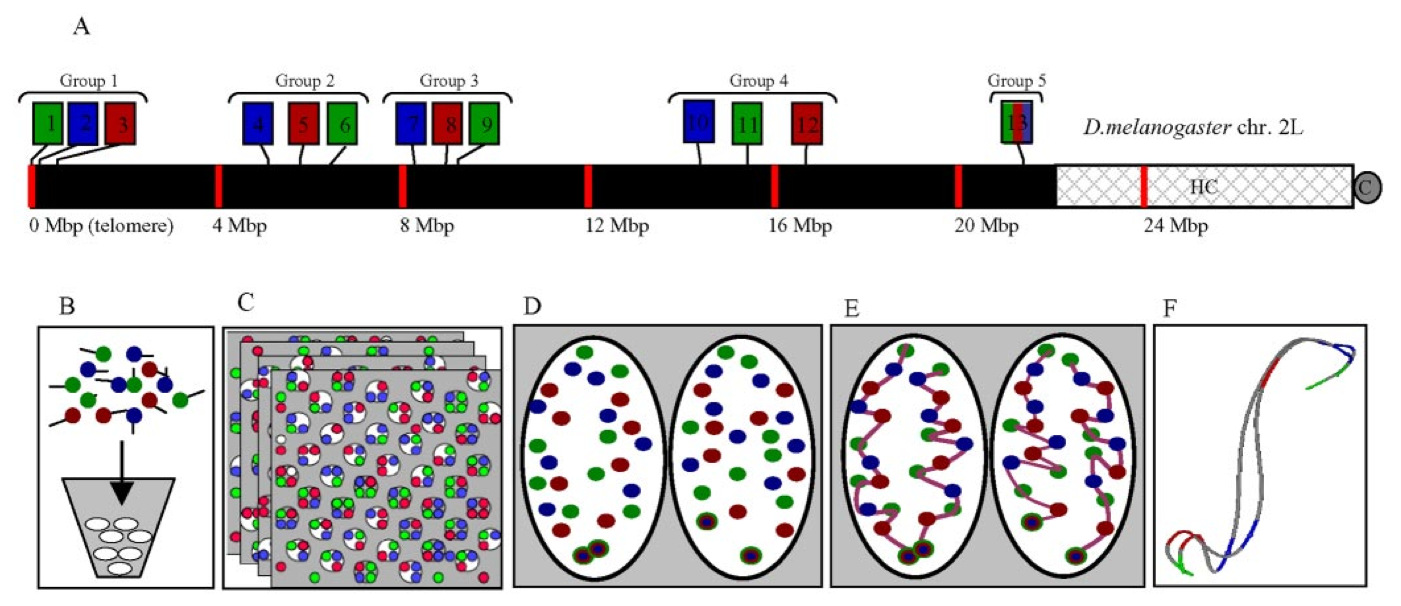
Figure 2. Experimental design. (A) A three-color, 13-probe barcode was designed which maps to D. melanogaster chromosome 2L. Probe localizations are based on release 3 of the Drosophila Genome Project Map. Euchromatin is shown in black (22.2 Mbp), heterochromatin is shown in gray mesh (6.2 Mbp), and the gray circle labeled C indicates the centromere. The probe labeled 13 maps to the histone locus and was labeled in all colors. The remaining probes were labeled with one color each. (B) The cut and labeled barcode probes were hybridized to cycle 14 Drosophila embryos. (C) Embryos were imaged using 3D wide-field fluorescence microscopy, and the data sets were deconvolved. (D) Nuclei and probe signals were segmented. (E) Chromosome paths were deduced using criteria described in the text. (F) The set of traces was subject to structural analysis.
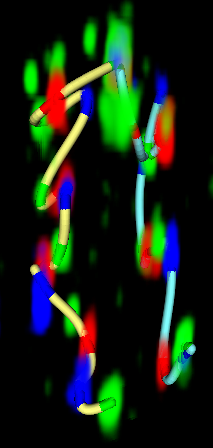
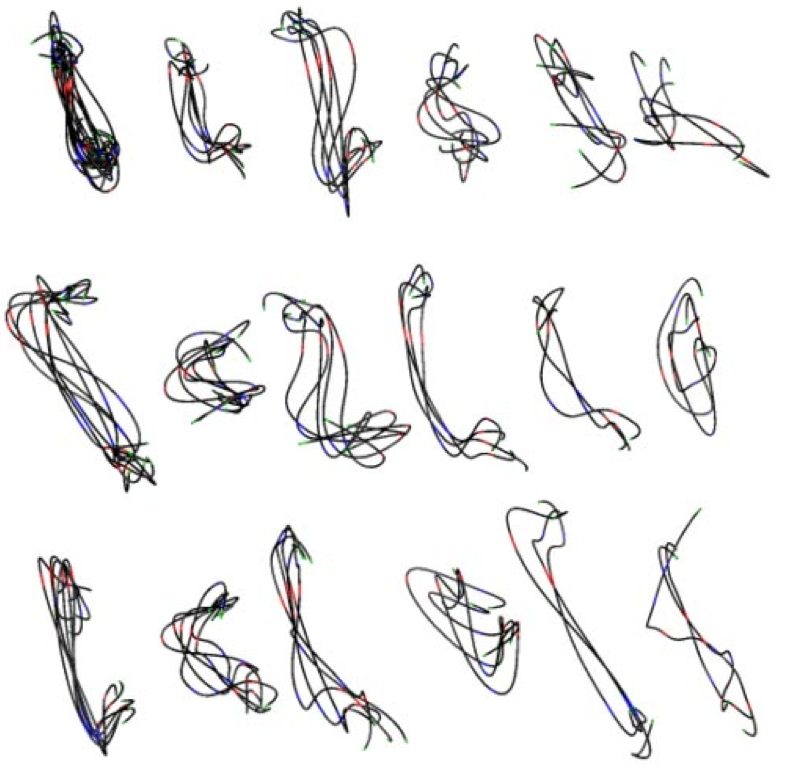
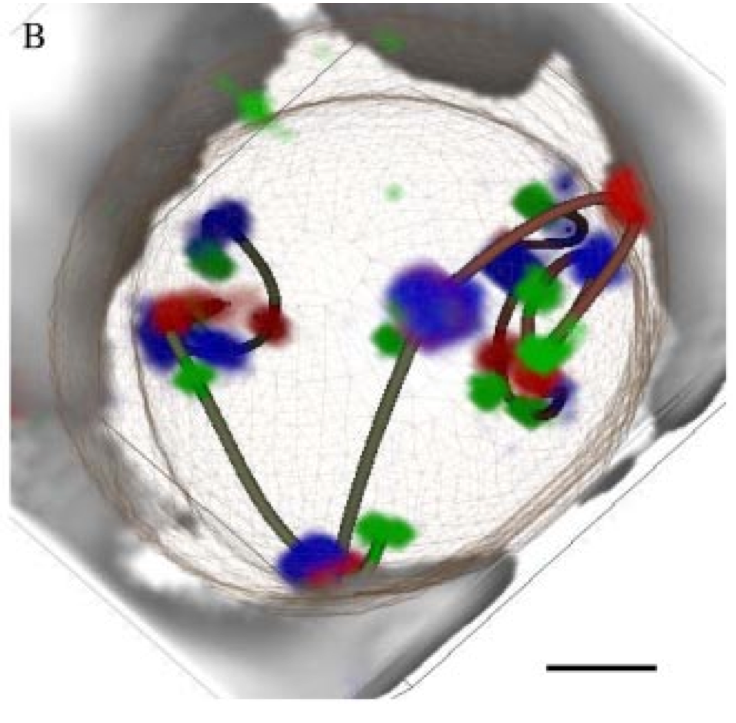
Figure 3. (Left) Traced path for one nucleus. (Middle) Paths clustered by shape. (Right) Trace and nuclear envelope surface used for measuring statistics of loci distances to envelope.
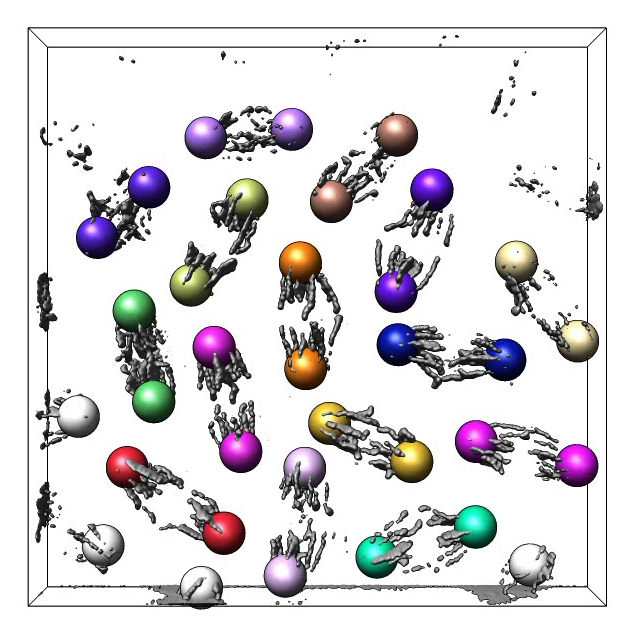
Figure 4. Volume time series showing Drosophila cells undergoing mitosis. Corresponding daughter cells are tracked with colored markers.
Tracking chromosome arms during mitosis.
Tom Ferrin (UCSF) - PI.
Greg Couch - molecular graphics.
Conrad Huang - project leader.
Elaine Meng - documentation.
Eric Pettersen - molecular sequence and structure.
John Sedat (UCSF) - PI.
Mike Lowenstein - barcode data.
Yuri Strukov - mitosis data.
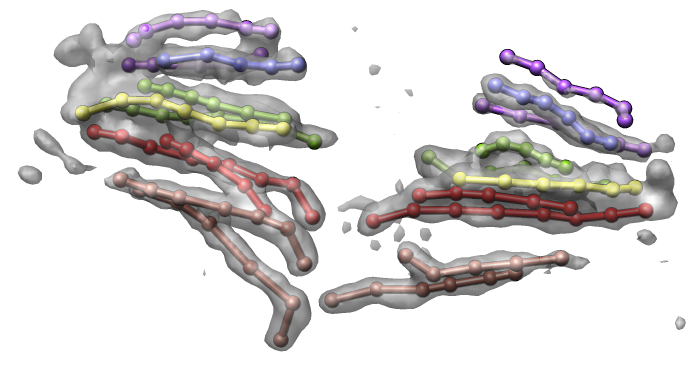
Manfred Auer (LBNL) - tip link EM tomography.
Roger Craig (U. Mass.)- myosin single particle EM.
Alex McPherson (UCI) - virus atomic force microscopy.