Given the structures of ligand and receptor molecules, docking programs calculate possible binding modes. In virtual screening, small organic compounds (typically from a database of many thousands) are treated as possible ligands, and a target macromolecule is treated as the receptor. Various scoring methods are used to identify the most favorable binding modes of a given compound and then to rank the compounds. Researchers then screen the results interactively to decide which compounds should be tested in the real world.
The ViewDock tool facilitates interactive analysis of receptor-ligand docking results. This tutorial uses the results of searching a very small database against H-ras (Protein Data Bank entry 121P) with the program DOCK.
To follow along with the tutorial, first download the following files to a convenient location (all should be placed in the same folder or directory):
A splash screen will appear, to be replaced in a few seconds by the main Chimera graphics window or Rapid Access interface (it does not matter which, the following instructions will work with either). If you like, resize the Chimera window by dragging its lower right corner.
Start ViewDock (Tools... Surface/Binding Analysis... ViewDock). With the resulting dialog, set file type to Dock 4, 5 or 6, and locate and open ras.mol2, the file of docked ligands.
|
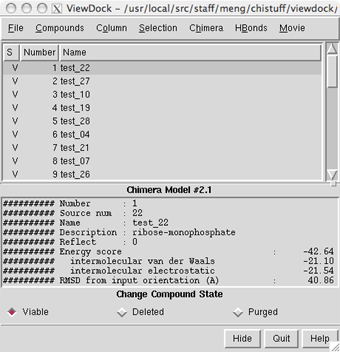
The ViewDock ListBox will appear, and the first ligand in the file will be displayed in the graphics window. Move the ListBox aside if it is obstructing the graphics window or any of the other tools.
Next, we will open the structures of the receptor and its co-crystallized ligand and display them in a way that is convenient for evaluating the docked molecules. Often many different files of docked molecules will need to be evaluated in the context of the same receptor. It can be tedious to set up the same view over and over. One approach is to save a session with the target protein displayed as desired, and then repeatedly restart that session before opening different files of docked ligands with ViewDock. Another approach (used in this tutorial) is to put the necessary commands in a file and simply execute the command file as needed.
The command file (setup.com) contains:
open receptor.pdbSimply opening a command file will execute its contents. Choose File... Open, make sure the file type is all (guess type) or Chimera commands, and locate and open setup.com.
open GCP.pdb
preset apply interactive 1
color aquamarine #1
disp #1 & #0 z<5
color orange,a #1@o=
color medium blue,a #1@n=
color magenta #2
repr bs #2
The lowest available model number is used for each successive structure opened, so the docked molecules (opened before the command file) are model number 0, the receptor is model 1, and GCP is model 2. Besides opening structures, the command file applies a ribbon/sticks preset, colors the receptor aquamarine, and displays receptor residues within 5 Å of any docked molecule. Oxygen atoms in the receptor are colored orange, nitrogens medium blue. The co-crystallized ligand GCP is shown in magenta ball-and-stick.
Throughout the tutorial, adjust the view as desired with the mouse and Side View (Tools... Viewing Controls... Side View).
The co-crystallized ligand GCP (shown in magenta) indicates the location of the active site. Ctrl-click to select any atom in GCP, press the keyboard up arrow to promote the selection to the whole residue, and then hide it:
Menu: Actions... Atoms/Bonds... hideThe docked compounds are enumerated in the top part of the ViewDock ListBox. If the ListBox has become obscured by other windows, it can be resurrected with Tools... ViewDock (near the bottom of the menu, below the horizontal line)... Raise. Since in this case Name is not very informative, it may be helpful to add other descriptors to the listing. Use the Column menu to show Description and Energy score, and to hide Name and Number.
Menu: Select... Clear Selection
Clicking on a line chooses the corresponding compound: the line is highlighted, just the chosen compound is shown in the main graphics window, and more detailed information is shown in the lower part of the ListBox. Try clicking various lines in the ListBox to choose different docked molecules. Multiple compounds may be chosen at once. Ctrl-click adds to an existing choice rather than replacing it. To choose a block of compounds without having to hold down the mouse button, click on the first (or last) and then Shift-click on the last (or first) in the desired block.
The listing can be sorted by any column, by clicking on the header. Make sure the list is sorted by Energy score, with the most negative values (which are the most favorable) at the top. Scroll down to the lowest line in the top panel of the ListBox and click on it to choose the worst-scoring molecule.
| worst-scoring molecule |
|---|
 |
As shown in the figure, this compound is not docked in the active site like the others. Its docking scores are zero.
There are three mutually exclusive states that can be assigned to docked compounds. Viable compounds are interesting (or have not been looked at yet), Deleted compounds are less interesting but may deserve another look, and Purged compounds are definitely not interesting. The S column shows V, D, and P to indicate these states. Viable and deleted but not purged molecules are included when File... Rewrite is used. Change the status of the worst-scoring molecule to purged by clicking the Purged checkbox near the bottom of the ListBox. Note that its listing disappears; make it reappear by checking the box next to List Purged in the Compounds menu.
Normally, a user will click on successive lines, examine the compounds in the binding site, and change the status of less interesting compounds to deleted or purged. Compounds can also be chosen by descriptor values and then changed in status collectively. As an example, we will calculate hydrogen bonds between the compounds and the receptor, then mark compounds with only 0-1 hydrogen bonds as purged.
HBonds... Add Count to Entire Receptor brings up the FindHBond tool. In that dialog, make sure the inter-model mode is set. The hydrogen bonds will be shown as lines; increase the Line width to 3 and change the H-bond color to yellow (clicking the color well opens the Color Editor, in which a new color can be chosen; one way to change the color is to enter a new Color name, in this case yellow). Click OK. When the calculation is finished, new columns of descriptors will appear in the ListBox. Again, individual compounds can be examined by clicking on their respective lines in the ListBox. Use the Column menu to hide the descriptors HBond Ligand Atoms and HBond Receptor Atoms (the numbers of ligand and receptor atoms, respectively, participating in the detected ligand-receptor hydrogen bonds).
Compounds... Choose by Value opens an interface with several sections. Choose from Viable compounds and uncheck the boxes next to Description and Energy score to collapse the corresponding sections. In the HBonds (all) section, move the sliders to include 0-1 hydrogen bonds. A message near the top of the Choose by Value dialog will report that 17 of the 29 viable compounds meet the criteria. Click OK to choose the compounds and dismiss the dialog. The 17 viable compounds with 0-1 hydrogen bonds to the receptor will be chosen in the ListBox and displayed in the main Chimera window. Change these compounds to purged by clicking the Purged checkbox near the bottom of the ListBox. Uncheck the box next to List Purged in the Compounds menu to remove the purged compounds from the listing.
| binding site surface and H-bonds |
|---|
 |
Finally, flip through the remaining listed compounds with the Movie feature. First, show the surface of the protein and make it transparent:
Menu: Select... Structure... proteinIn the ListBox menu, choosing Movie... Play flips through all of the listed compounds, in the order in which they are listed, regardless of status. It is possible to change the view and move the molecules around while the movie is playing. The movie will loop continuously through the list until halted with Movie... Stop. The length of time each compound is shown can be controlled with Movie... Options. If molecules are “unlisted” using the checkboxes in the Compounds menu, they will not be included in the movie; in addition, the order of display depends on how the molecules are sorted. No matter how the molecules are sorted in the ListBox, however, they remain in the original order (minus any purged compounds) in output files created with File... Rewrite. Once you have seen enough, stop the movie and exit from Chimera:
Menu: Actions... Surface... show
Menu: Actions... Surface... transparency... 60%
Menu: Select... Clear Selection
Menu: File... Quit