
MinRMS generates structural alignments (superpositions) of the molecules in the input PDB files pdb1 and pdb2. Many options are described below. The filters allow specification of subsets of the input structures.
MinRMS is a stand-alone, nongraphical program; it is run from the system command line, not from within Chimera. MinRMS is not distributed with Chimera, but can be downloaded separately.
The AlignPlot extension of Chimera (or the Collaboratory-aware alternative, Minrms Plot) can be used to display and analyze the results from MinRMS.
QUICK START TIPS: A beginning user should scan the METHOD and DISPLAY sections, then look over the EXAMPLES, particularly the first, and the OPTIONS used therein.
For each superposition, a list of sets of matched residues is prepared. The list has N entries, where N is the smaller of the number of residues in pdb1 and the number of residues in pdb2, both subject to any command-line filters and excluding HETATM records and residues that do not have an atom named CA. The nth item on the list contains the n residue pairings (pdb1-pdb2) that have the lowest root-mean-square distance (RMSD) of any set of n residue pairings in that particular superposition. This is determined by a dynamic programming algorithm which takes chain directionality into account and allows any number of gaps. Circular permutations (wraparound matchings) are not allowed.
The next stage is comparison among superpositions. Another list with N entries is constructed, where the nth item on the list contains the n residue pairings (pdb1-pdb2) that have the lowest RMSD of any set of n residue pairings in any of the superpositions generated and a reference to the associated superposition. In general, the information in this "lowest-RMSD list" is written out into files interpretable by Chimera: align_chimera.info, align_chimera.plot, and several sequence alignment files in MSF format, by default named align2.msf...alignN.msf (or some subset of these, designated by cutoff options). Alignments of one residue pair would be meaningless and are not included.
The MinRMS program is primarily intended for detailed comparison of proteins of known or suspected similarity. It is not well-suited, nor would it be computationally feasible for most users, to search structural databases or perform all pairwise comparisons within a large set of structures.
The nth entry of the "lowest-RMSD list" consists of a structural alignment and the n residue pairings within it used to calculate the RMSD. Each list item can be expressed as a sequence alignment in MSF format (file alignn.msf); the corresponding rotation/translation information is included in the comments. The n residue pairings are aligned in sequence within the MSF file. Other residues are treated as insertions. Multalign Viewer or MSF Viewer can be used to display the sequence alignments while the structural alignments are being viewed with AlignPlot (or Minrms Plot).
AlignPlot is used to display structural alignments and associated data from MinRMS within Chimera. There are several ways to start AlignPlot, a tool in the Homology category. Starting AlignPlot brings up a dialog box requesting the file align_chimera.info previously created by MinRMS. This file lists the input files pdb1 and pdb2, the name of the plot data file (currently just align_chimera.plot), and the number of alignment files to be read.
| Chimera graphics window |
|---|
 |
Upon reading the file, Chimera will display the molecules in pdb1 and pdb2 in the graphics window and open an additional AlignPlot window containing graphs (explained below). The graphs are displayed as "cards," so that only one is visible at a time; clicking on the tab for a particular graph brings it to the front. Initially, the molecules are not superimposed (and may not both be visible); their positions depend on the coordinates in the input PDB files. Showing just the backbone or chain trace of proteins is recommended to simplify the display.
| RMSD vs. N graph |
|---|
|
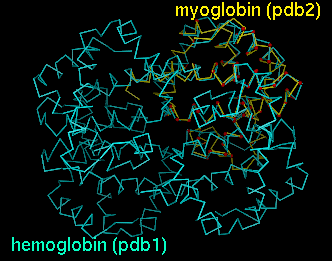
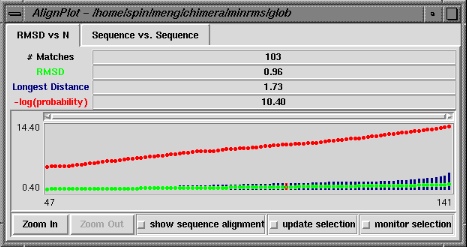
The RMSD vs. N graph depicts the members of the "lowest-RMSD list" of structural alignments that have been written out as MSF files. RMSD is shown in green, the longest distance between paired residues in blue, and an adaptation of the Levitt-Gerstein probability score (4) in red versus increasing number of residue pairings, or "matches." The -log(probability) is shown, where probability represents the likelihood that such a favorable superposition could be attained by chance (proteins not structurally related); larger values of -log(probability) indicate greater significance. Clicking with the mouse within this graph determines which structural alignment is displayed in the graphics window. The structure in pdb1 is static (unless moved interactively by the user) and the structure in pdb2 is reoriented relative to the first. Residue pairings are indicated in red in the graphics window.
There are three checkboxes at the bottom of the RMSD vs. N graph when it is displayed at full size. If show sequence alignment is activated, Multalign Viewer will start automatically and display the sequence alignment corresponding to the current structural alignment (or if there is none, it will start as soon as a structural alignment is chosen); when the structural alignment is changed by clicking on the graph, Multalign Viewer will switch automatically to the corresponding sequence alignment. Activating update selection causes all pairs matched in the current structural superposition to be selected. In contrast, if a selection is made by some other means, activating monitor selection causes display of two additional types of data: the proportion of the selection that is matched is shown in teal, and the RMSD of those matched pairs is shown in magenta. Both are plotted against N for members of the "lowest-RMSD list" of structural alignments. It is not useful to monitor the selection when update selection is activated, because the information is already shown in the basic graph.
| Sequence vs. Sequence graph |
|---|
|
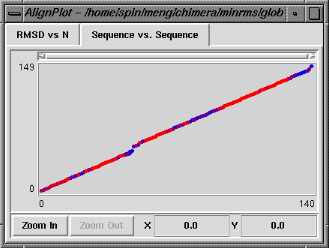
The Sequence vs. Sequence graph shows which residues in pdb1 are paired with which residues in pdb2 (numbering sequentially after application of any filters). It is actually a contour plot summarizing the entire set of alignments, with the pairings that occur more frequently shown in warmer colors. Clicking on this graph does not change which structural alignment is displayed, but causes the backbone atoms of the corresponding pair of residues to be shown as balls in the graphics window. Note that the two residues do not necessarily form a pairing in the superposition currently displayed.
If the AlignPlot window becomes obscured by other windows, it can be resurrected using the Raise option for the AlignPlot instance in the Tools menu. There is also a Quit option, which closes the window and exits from AlignPlot.
If only a subset of the residues in a PDB file is to be used for generating superpositions, this can be indicated by filters denoting the residues and chains of interest. Filters should immediately follow the name of the PDB file and a comma (no space) and take the general form:
start-end.chainwhere start and end are residue sequence numbers which may include an insertion code (e.g., 100 or 100A) and chain is a chain identifier such as A. The dashes and periods are to be taken literally. Wild cards are permitted: if start is *, the first residue is used; if end is *, the last residue is used; if chain is *, all chains are used. Omissions are also permitted: if only one residue number is given, it is used as both start and end for that segment; if start-end is omitted or replaced with *, all residues are used; if .chain is omitted (or if chain is replaced with *, as mentioned above), all chains are used. Finally, chain may be a range such as A-C. If the command contains * and is typed in from the shell rather than included in a configuration file, the argument should be enclosed by quote marks " ". Capitalization is important for chain and insertion code. See the first and third examples.
or
start-end.chain,start-end.chain
(etc. for multiple segments)
Residues with ATOM records included in the PDB files but excluded by the filters will still appear in the output MSF files and the Chimera display; if this is not desired, they should be removed from the input PDB files. Residues present only as HETATM records in the PDB file will not appear in the MSF file, although they will be displayed in Chimera. In general, solvent, ion, and other molecules that are not peptides or nucleotides are present as HETATM records.
-cfg config_file
Rather than being typed out on the command line, MinRMS arguments including pdb1[,filters] pdb2[,filters] can be entered into a configuration file config_file. The options within do not have to be on a single line; "\" can be used to indicate line continuation (as in the examples). Text following "#" in any line is ignored, allowing comments to be included. Configuration files can be combined with any number of options typed on the command line, as long as the two PDB files are specified last. The -cfg flag can be used more than once, and configuration files can invoke other configuration files. If arguments conflict (for example, if both -hs and -HS are included), arguments appearing later in the list override arguments earlier in the list. If a MINRMS_SETTINGS_FILE environment variable has been set, the arguments in this configuration file will be loaded first.
-fm L
L is the fragment length to be used for generating superpositions. All contiguous fragments of L residues in pdb2 will be superimposed on all contiguous fragments of L residues in pdb1. This only applies to residues with ATOM records that contain CA (or the atom name(s) specified in atoms.file); HETATM residues are ignored. L must be an integer. Specifying L=0 turns off the generation of superpositions by fragment matching (rarely used); otherwise, L should be at least 3 (default 4). Using -FM also turns off fragment matching.
-hs
Only residues within the secondary structures defined by HELIX and SHEET records in the PDB file are to be used for generating superpositions. Helix fragments will only be superimposed on helix fragments and sheet fragments will only be superimposed on sheet fragments, which reduces sampling and decreases run time. Note that there must be HELIX and SHEET records in each PDB file. In fact, -hs is not necessary since this behavior is the default; -HS turns the feature off, so that fragments are matched regardless of secondary structure.
-read-msf name1,name2 file1.msf[,file2.msf,...]
A least-squares fit of residues aligned in each input MSF file is used to generate a superposition. This flag can be used together with or instead of -fm. Since MSF files may contain more than two sequences, it is necessary to specify name1 and name2, the names of the sequences within the MSF file(s) corresponding to the structures pdb1 and pdb2, respectively. In fact, if the input MSF files were generated with MinRMS, name1 and name2 will be the same as pdb1 and pdb2 in the original command. The output MSF files will not necessarily be the same as in the input MSF files; an input MSF file determines which residue pairings are used for orientation or superposition, while an output MSF file reflects spatial proximity in the result (if a set of n pairings within the superposition has the lowest RMSD of any set of n pairings in any of the superpositions generated during the run). Input MSF files must contain at least three residue pairings.
-read-matrix file1.mat[,file2.mat,...]
Input translation/rotation matrices are used to specify orientations of the structure in pdb2 relative to its input coordinates. Each translation/rotation matrix file should contain three rows and four space-separated columns (free format). For example, if a matrix file contains the following:the new coordinates X', Y', and Z' are defined relative to the input coordinates X, Y, and Z according to:
0.98 0.19 -0.06 3.47 -0.18 0.98 0.10 -4.99 0.08 -0.08 0.99 5.86 This flag can be used together with or instead of -fm.
X' = 0.98X + 0.19Y - 0.06Z + 3.47 Y' = -0.18X + 0.98Y + 0.10Z - 4.99 Z' = 0.08X - 0.08Y + 0.99Z + 5.86
-fm-interval p1filters,p2filters
This rarely used flag is analogous to -hs, but the intervals to be superimposed are specified manually rather than by HELIX and SHEET records. p1filters and p2filters each take the same form as described above for filters except that only one interval in each PDB file may be specified per invocation of the flag. The names pdb1 and pdb2 are not included; p1filters must refer to pdb1 and p2filters to pdb2. The flag may be invoked multiple times in the same command, allowing multiple interval pairs to be specified for the run.
-r
In most cases, a superposition is initially obtained by fitting short stretches of residues to each other (length L specified with the flag -fm). The sequence alignment is then determined by spatial proximity in the structural alignment, and in general will contain more than L residue pairings. When refinement is specified with the -r flag, each structural alignment on the "lowest-RMSD list" (see METHOD) is iteratively adjusted by including the residue pairs found to be close together in space in the fit. In other words, the nth superposition on the "lowest-RMSD list" is adjusted to further minimize the RMSD of its n residue pairings. Alignments are iterated to convergence by steepest descent. Note that if suboptimal superposition sets have been requested using -alt-r, -alt-o, or -alt-o-orig, only the lowest-RMSD list of alignments will be refined. -R turns off refinement (on by default).
-ir
Intermediate refinement involves the same procedure as the refinement described above, except that it is applied at intermediate stages, before construction of the "lowest-RMSD list." Using both types of refinement is recommended since results are improved without a marked increase in run time. -IR turns off intermediate refinement (on by default).
-of distcut[,minprs]
Superpositions that do not contain at least minprs residue pairings with distances within distcut are thrown out. The parameter minprs may be expressed as an integer ranging from 1 to N (defined in METHOD), which is interpreted literally, or a fraction ranging from 0 to 1, which is multiplied by N. The minprs argument is not necessary when also specified with -minN (below), but a different value may be used if desired. This orientation filtering is turned off by -OF (and is off by default).
-minN minprs
For each superposition, only alignments with minprs or more residue pairings are found and stored. High values of this parameter can reduce computation time substantially. Any output MSF files alignn.msf will have n equal to or greater than minprs. The parameter minprs may be expressed as an integer ranging from 1 to N (defined in METHOD), which is interpreted literally, or a fraction ranging from 0 to 1, which is multiplied by N.
-maxN maxprs
For each superposition, only alignments with maxprs or fewer residue pairings are found and stored (completely analogous to -minN above). This can be used to save time and memory when it is known that high-quality alignments will not contain more than maxprs residue pairings. The parameter maxprs may be expressed as an integer ranging from 1 to N (defined in METHOD), which is interpreted literally, or a fraction ranging from 0 to 1, which is multiplied by N.
-max-rmsd rmsdcut
The search for lowest-RMSD pairings by the dynamic programming algorithm is speeded up by early termination when the RMSD exceeds rmsdcut Angstroms. A value of 3.5 is usually appropriate.
-max-dist maxdcut
Paired (aligned) residues must be within maxdcut Angstroms of each other. Values of 5.5 to 10.0 Angstroms are appropriate in most cases.
It is possible to save, in addition to structural alignments on the "lowest-RMSD list" (see METHOD), the "second-lowest-RMSD list," "third-lowest-RMSD list," etc. If the mth lowest-RMSD list is saved, the output MSF files are named alignm_n.msf, where n is the number of residue pairings within each structural alignment used to calculate the RMSD.
One problem that arises when additional lists are saved is that the resulting structural alignments may be extremely similar to their lowest-RMSD counterparts. The two flags that specify additional lists should be saved also indicate different methods for deciding whether structural alignments are different enough to be considered distinct solutions.
-alt-r M[,prs_sim][,rmsd_ratio]
Save M lists of structural alignments, from the lowest RMSD to the Mth lowest RMSD. This option is time-consuming and scales approximately linearly with M. Structural alignments with the same number of residue pairings will be considered identical if they have more than prs_sim pairings in common (default zero). A superposition will be discarded if the ratio of its RMSD to that of the lowest-RMSD superposition with the same number of residue pairings is greater than rmsd_ratio (values must be > 1.0; 1.5-3.0 recommended; default effectively high, so that no solutions are discarded on the basis of RMSD). Specifying rmsd_ratio prevents calculation of poor-quality alignments and yields substantial time savings when combined with -minN and at least one of the following: -maxN, -max-rmsd, or -max-dist. However, specifying rmsd_ratio increases memory usage and may not work on all systems; invoking "unlimit" before running is also recommended.
-alt-o M,orient_sim[,rmsd_ratio]
Save M lists of structural alignments, from the lowest RMSD to the Mth lowest RMSD. This option is much less time-consuming than -alt-r, but memory usage is high and it may not work on all systems; invoking "unlimit" before running is recommended. Superpositions with the same number of residue pairings will be considered identical if the RMSD between the two orientations of pdb2 (remember that pdb1 is fixed) is less than orient_sim Angstroms. Reasonable values are 4.0-15.0 Angstroms, depending on the size of pdb2. Use of rmsd_ratio is optional but recommended to reduce disk space usage by scratch (temporary) files; the meaning is the same as described above for -alt-r.
-alt-o-orig M,orient_sim[,rmsd_ratio]
Usage and parameters are the same as for -alt-o above; differences are that the temporary files are smaller and intermediate refinement (see -ir; on by default) is disabled. Use of -alt-o with a suitable rmsd_ratio value is generally preferred over use of -alt-o-orig.
-atoms-used atoms.fileThe atoms in each residue named in atoms.file are used for superposition and RMSD computation; the default is to use only the atom named CA. Four peptide backbone atoms would be used per residue if the file were to contain:
" N"
" CA"
" C"
" O"
without the quote marks, which are just there to show spaces. There cannot be extra spaces after the atom names. If more than one atom per residue is specified, options involving the distance between paired residues (-of, -max-dist) will instead use the RMSD between the sets of specified atoms in the paired residues. The example file can be copied and modified for your own use.
-res-code-dict rescodes.fileResidue names in the input PDB files must be translated into one-letter codes to allow output of sequence alignments in MSF format. By default, MinRMS "knows" the correct one-letter codes for the standard amino acid residues. The -res-code-dict flag should be used if an input PDB file contains nonstandard residues with ATOM records and a translation for these residues other than "x" is desired.
Invoking -res-code-dict turns off the defaults, so all residues present in the PDB file should be included in rescodes.file. The format is two columns separated by one or more spaces; the first line should be as shown (although another character may be substituted for "x"):
unknown x
ALA A
CYS C
CYX C
ASP D
JNK J
GLY G
ZZZ Z
(etc).
Residues not specified explicitly will be assigned according to the first line; otherwise, order is not important. Currently, only three-letter input codes can be handled. The one-letter codes cannot be numerals (0-9). The example file can be copied and modified for your own use.
minrms -fm 4 -of 8.0,0.33 -HS \
-minN 0.33 -max-rmsd 3.5 -ir -r \
hemoglobin.pdb,"*.A" myoglobin.pdb
PDB entries used: 4hhb (hemoglobin), 1a6m (myoglobin)Superimpose myoglobin (151 residues) on the A chain of hemoglobin (141 residues) using a fragment size of four residues; discard superpositions in which there are not at least 47 (141 x 0.33) residue pairings with distances within 8.0 Angstroms; only find and output alignments with at least 47 residue pairings and RMSD within 3.5 Angstroms; iteratively refine superpositions at all stages. The quotes surrounding the specification of hemoglobin's A chain are needed since an asterisk has been used (see FILTERS). The equivalent specifications
"hemoglobin.pdb,*.A"would also be acceptable. The images shown in the DISPLAY section correspond to this example.
or
hemoglobin.pdb,.A
**If the molecules are fairly large, and there are HELIX and SHEET records in the PDB files, using -hs instead of -HS is recommended. This specifies that only fragments that are both helical or both sheet will be superimposed. In fact, simply omitting -HS will activate this feature, since it is on by default.
minrms -HS -ir -r \
calmod.open calmod.closed
PDB entries used: 4cln (open form), 2bbm (closed form)Superimpose closed form of calmodulin (136 residues plus 19 residues of bound peptide in structure) on the open form of calmodulin (148 residues) using a fragment size of four residues (the default); iteratively refine superpositions at all stages. The -HS flag is needed because one of the files does not contain HELIX or SHEET records.
In general, if there is prior knowledge of which regions of the structures are structurally similar, it should be used (via filters or editing parts of the PDB files away). In this case, a bent dumbbell is being superimposed on a straight dumbbell and only about half of the molecule can superimpose well in any given orientation. If -minN 0.33 had been used, many visually pleasing superpositions with fewer than 49 (148 x 0.33) residue pairings would have been thrown out. Unless -max-rmsd or -max-dist were also used, most of the output superpositions would be of poor quality.
minrms -fm 3 -HS -ir -r \
tryp.pdb,57,100-105,194-200 \
chym.pdb,50-110.B,190-200.C
PDB entries used: 1ane (trypsin), 1ab9 (chymotrypsin)Superimpose chymotrypsin on trypsin, concentrating on the regions containing the catalytic triad (57, 102, and 195 in trypsin; 57 and 102 in chain B and 195 in chain C in chymotrypsin). The residues specified for each file must add up to at least the fragment length specified with -fm, and three is the minimum value allowed for this parameter. Although not contiguous in the protein trypsin, the residues 57 and 100 (for example) are contiguous for the purposes of MinRMS, in the sense that they are adjacent in the filtered set. It is not necessary for the number of residues specified in pdb1 to be the same as the number of residues specified in pdb2.